MetaGalaxy

heatmap

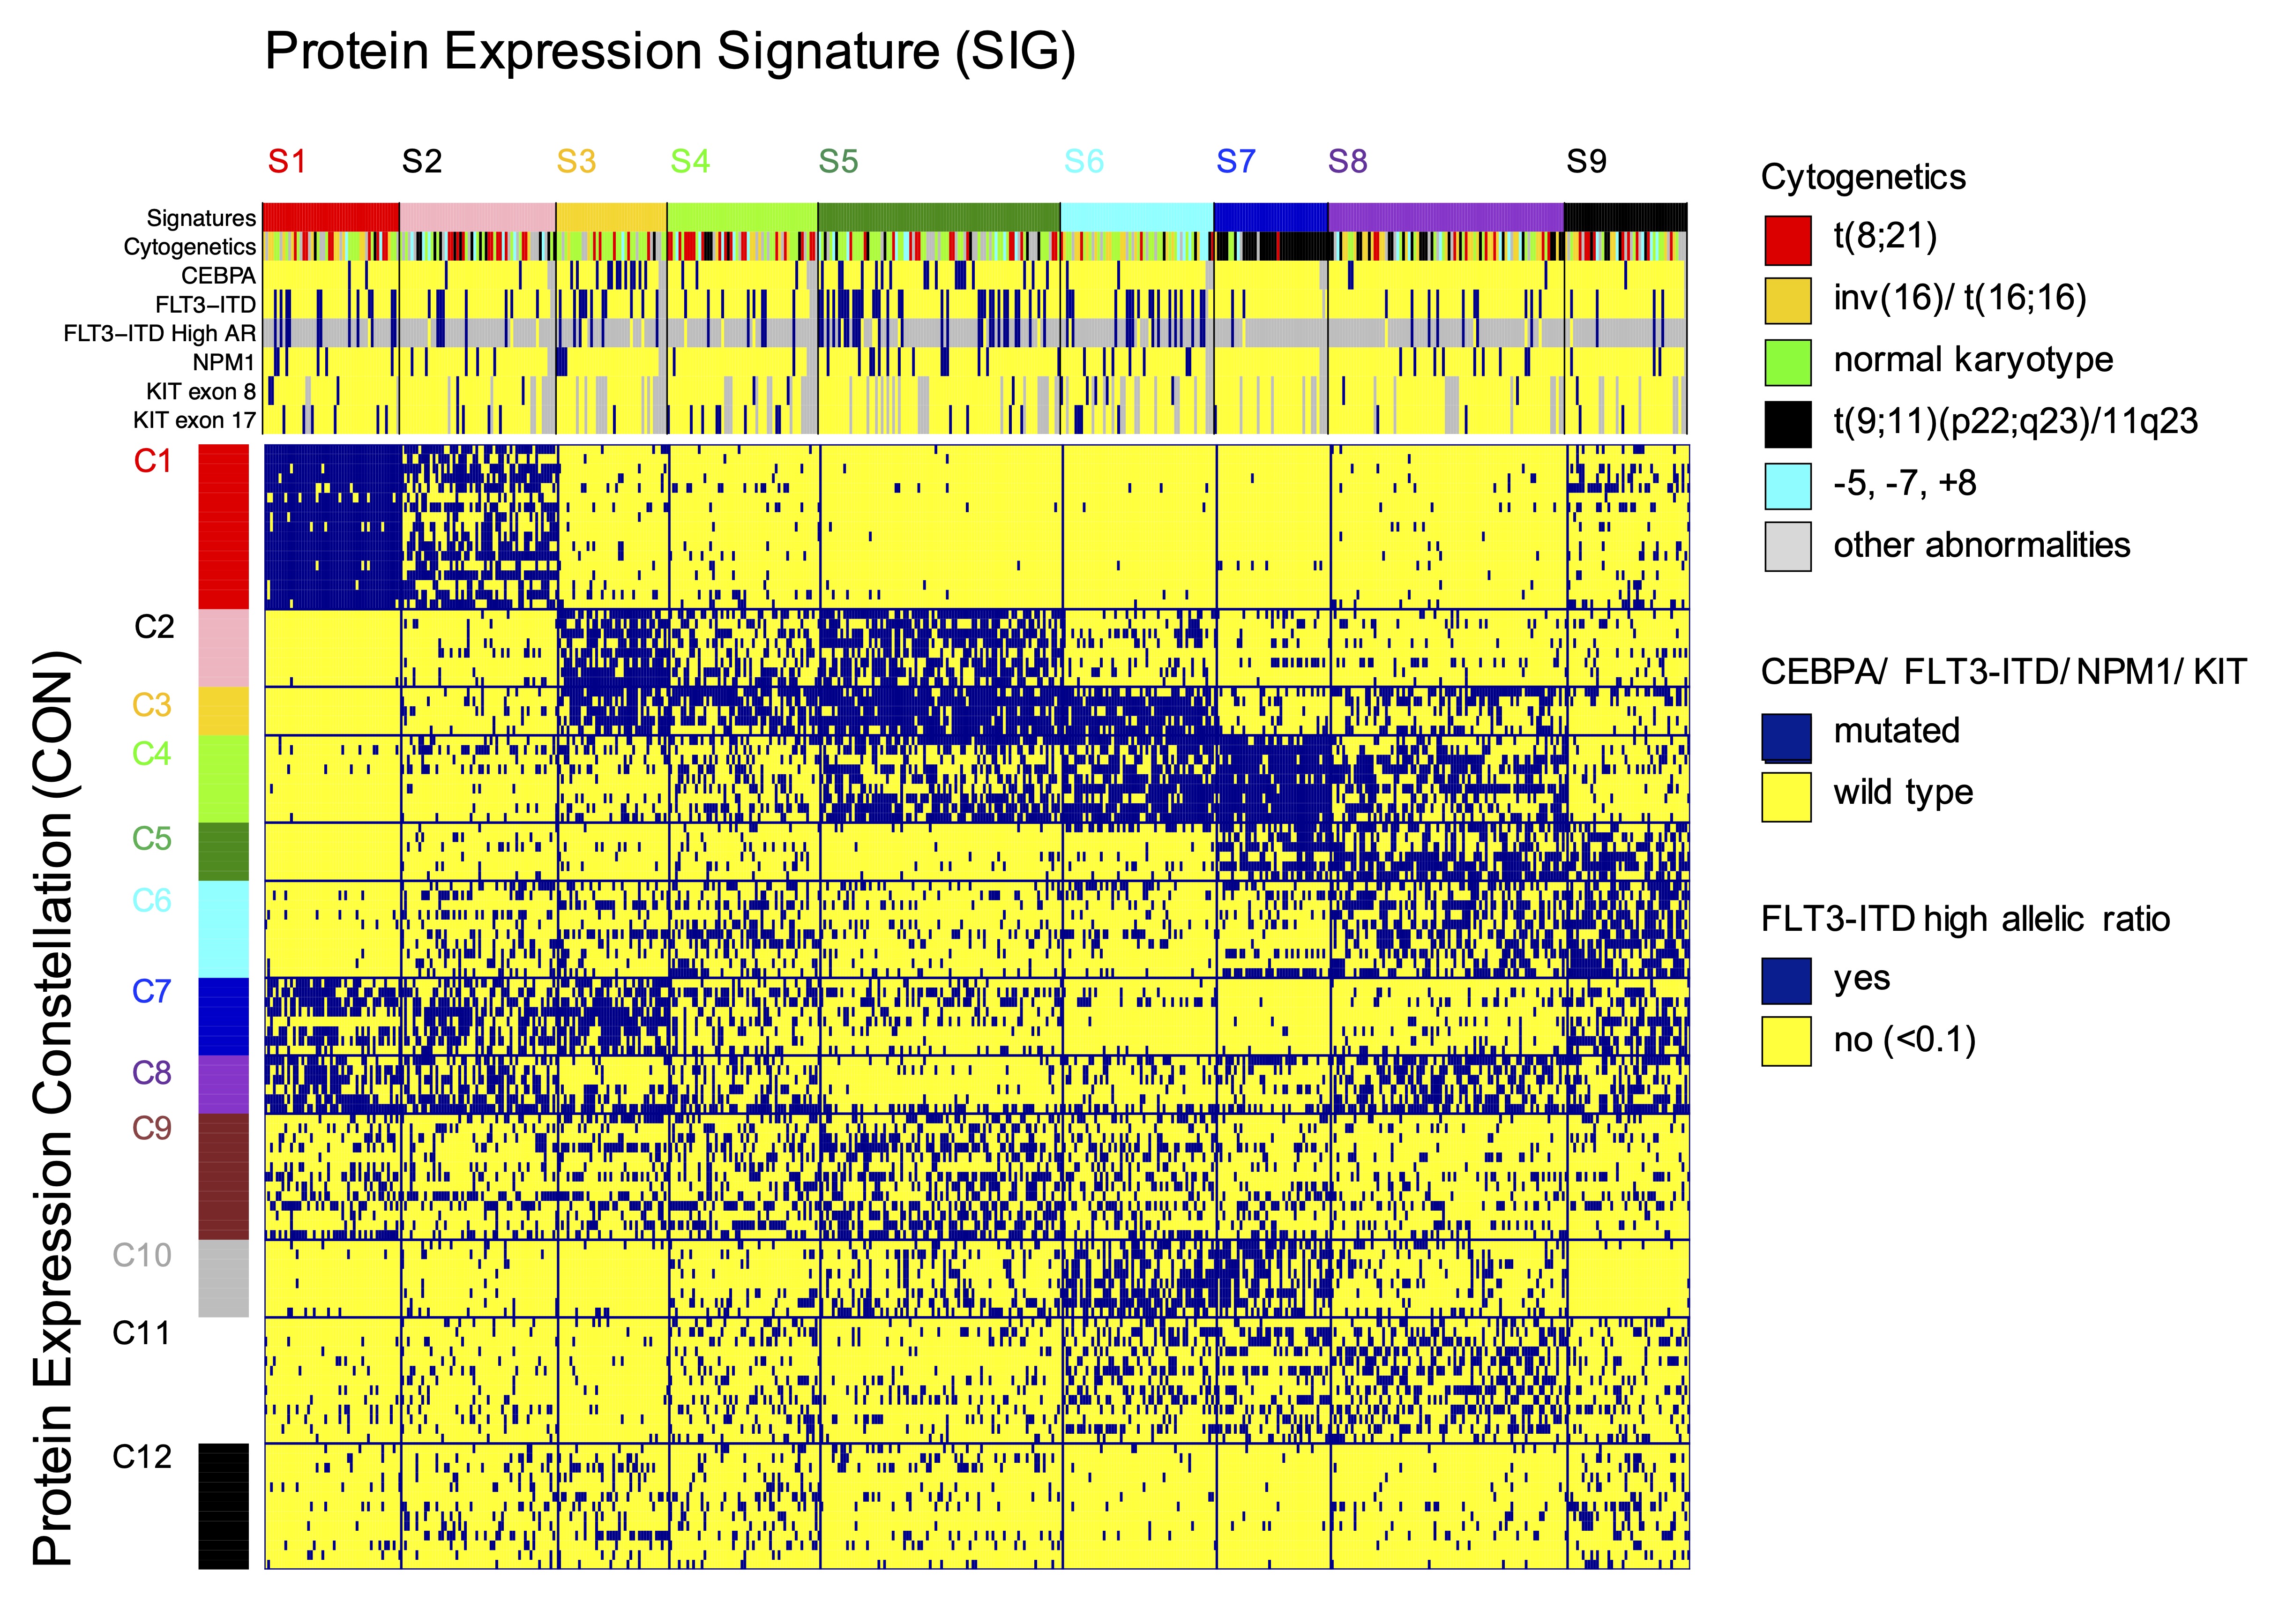
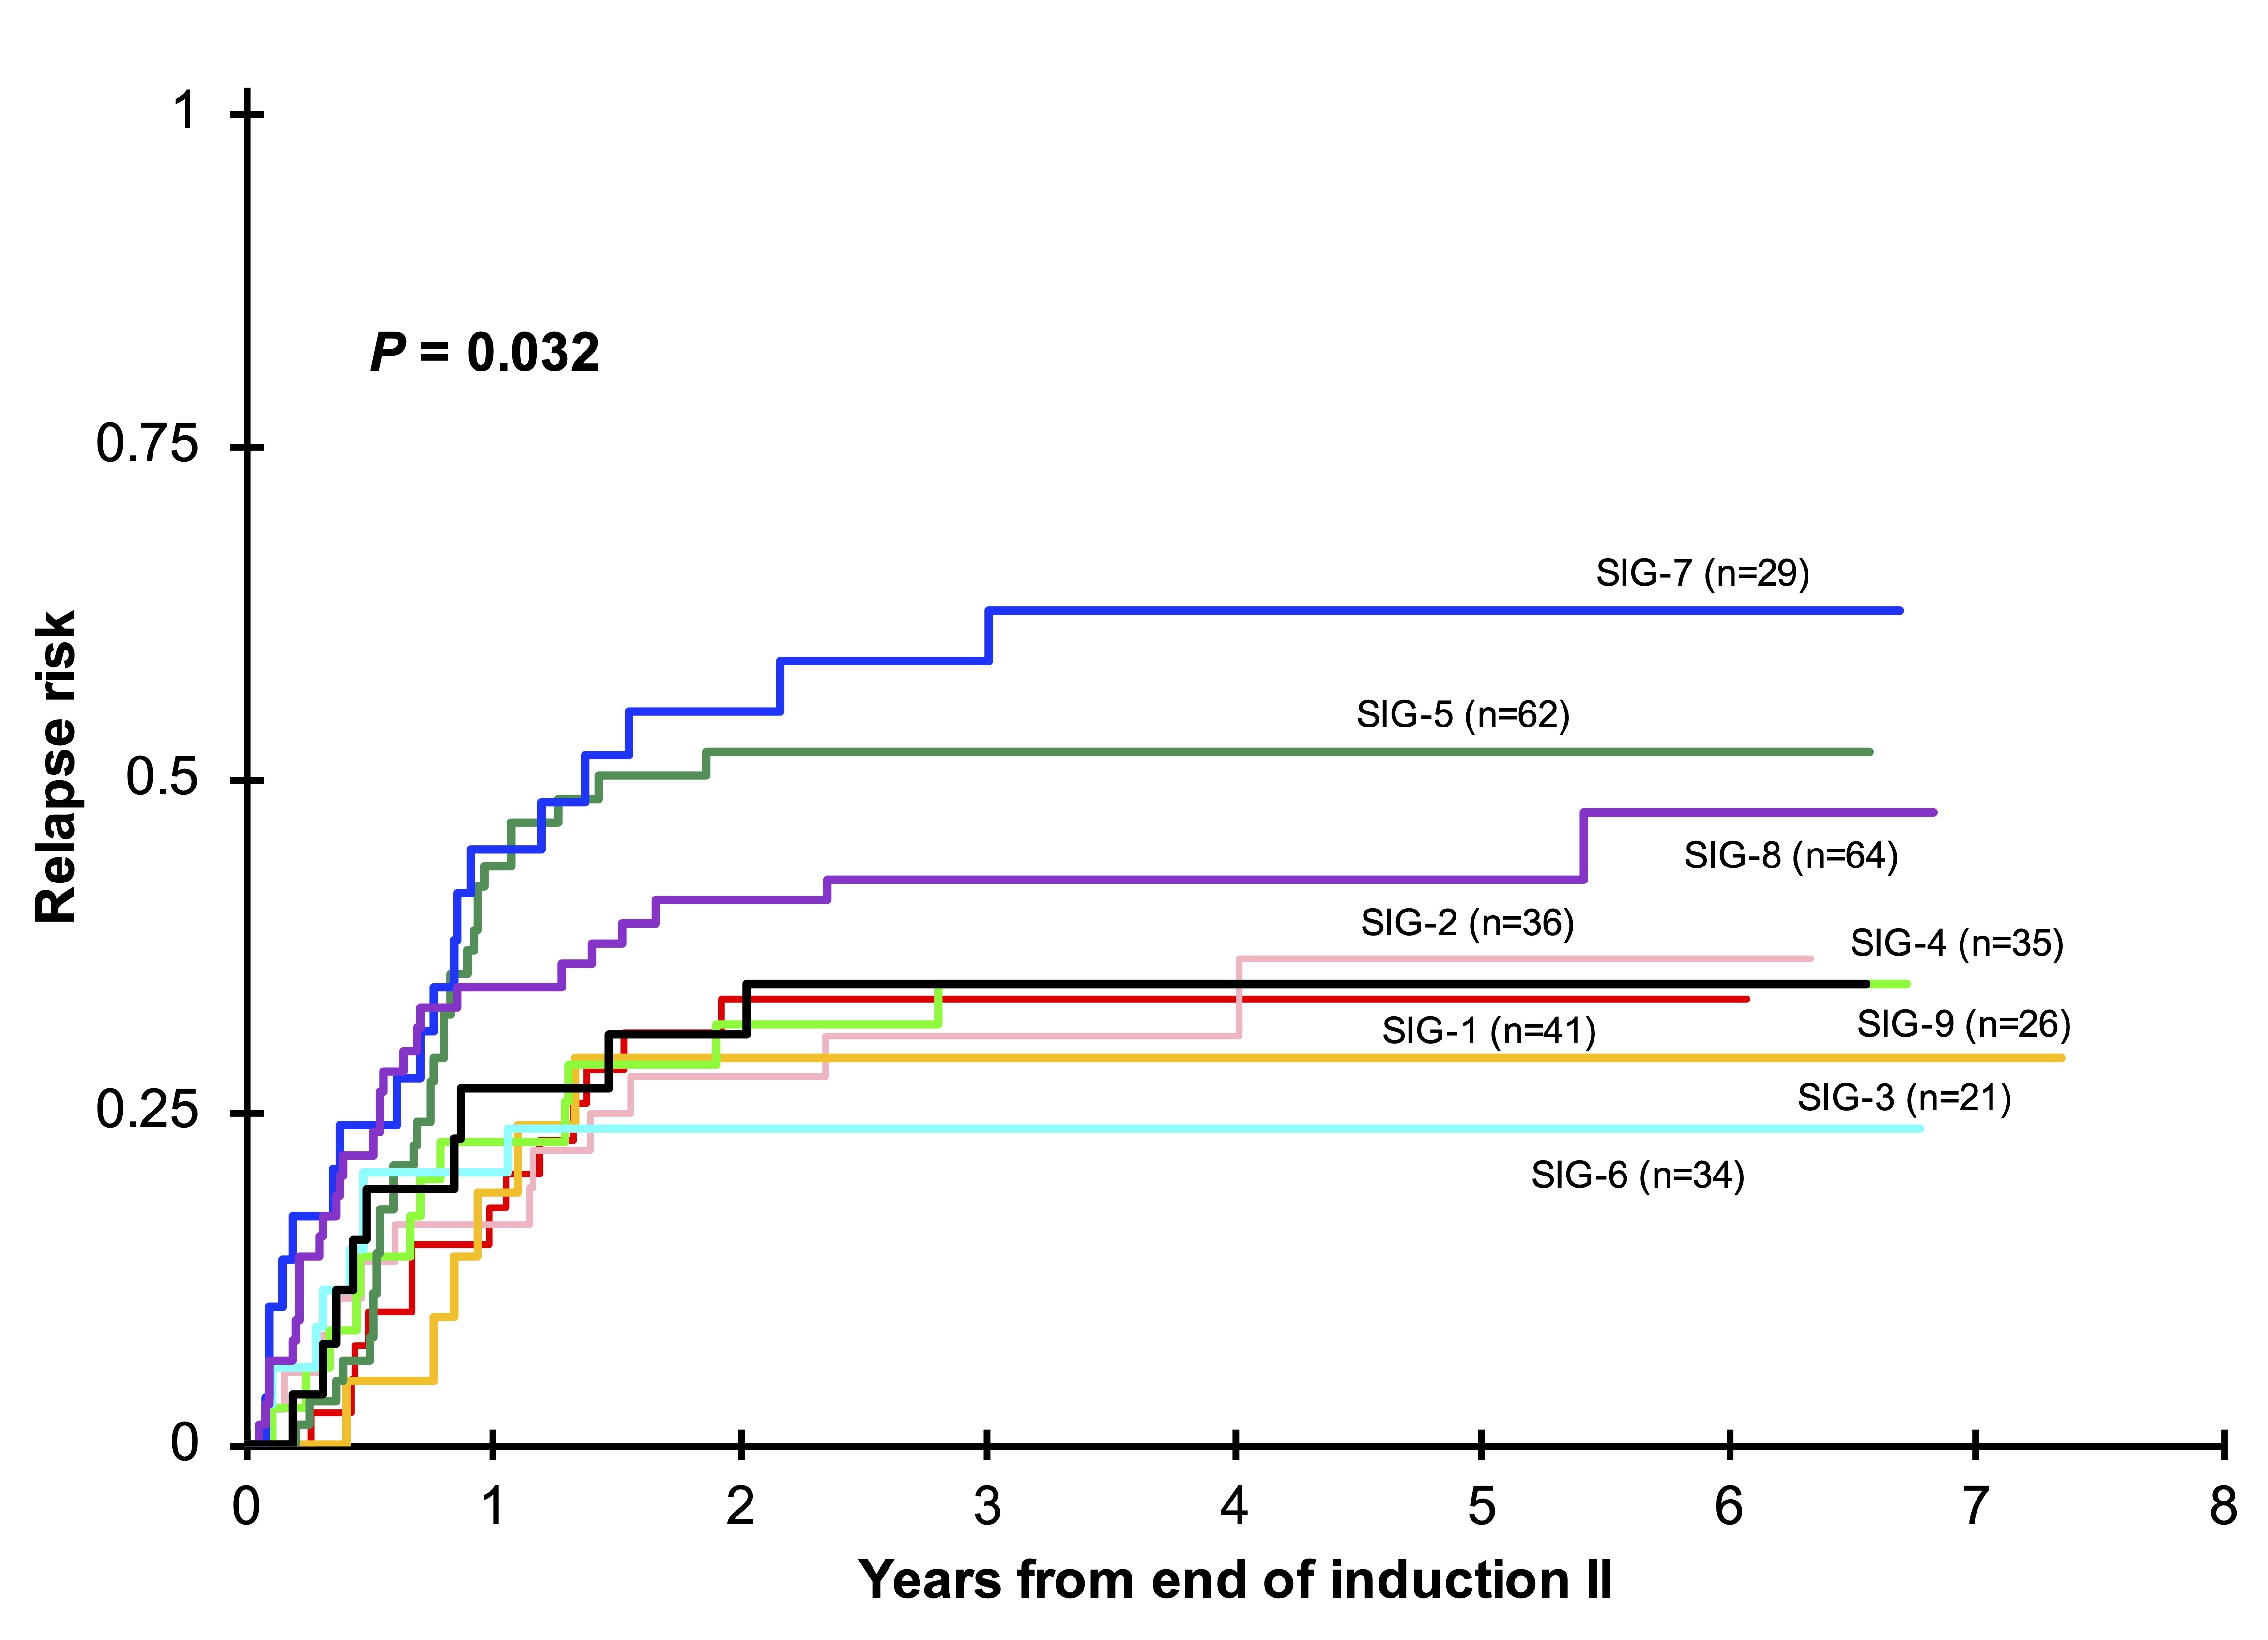
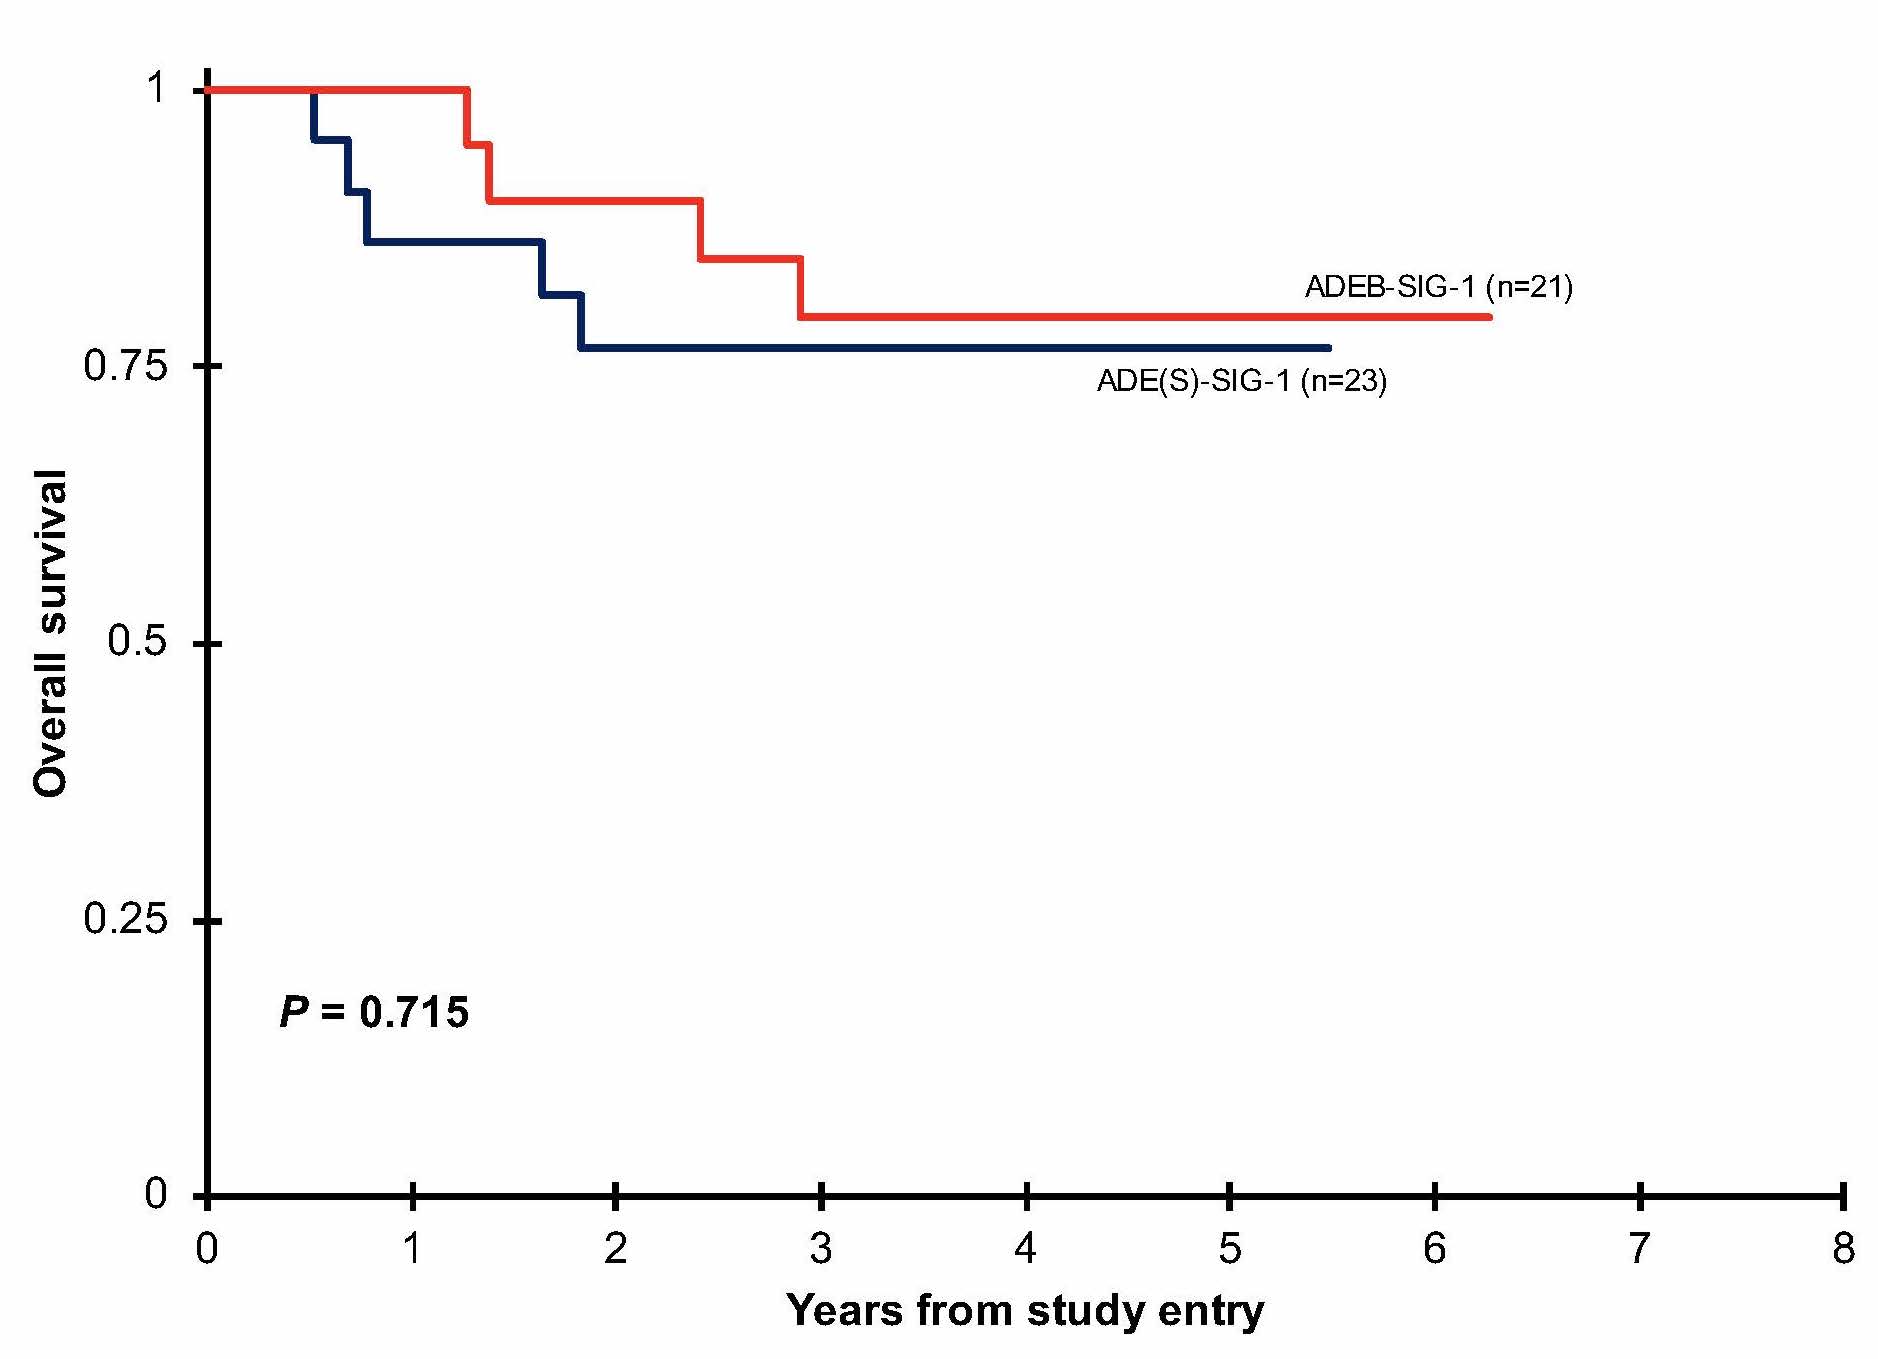
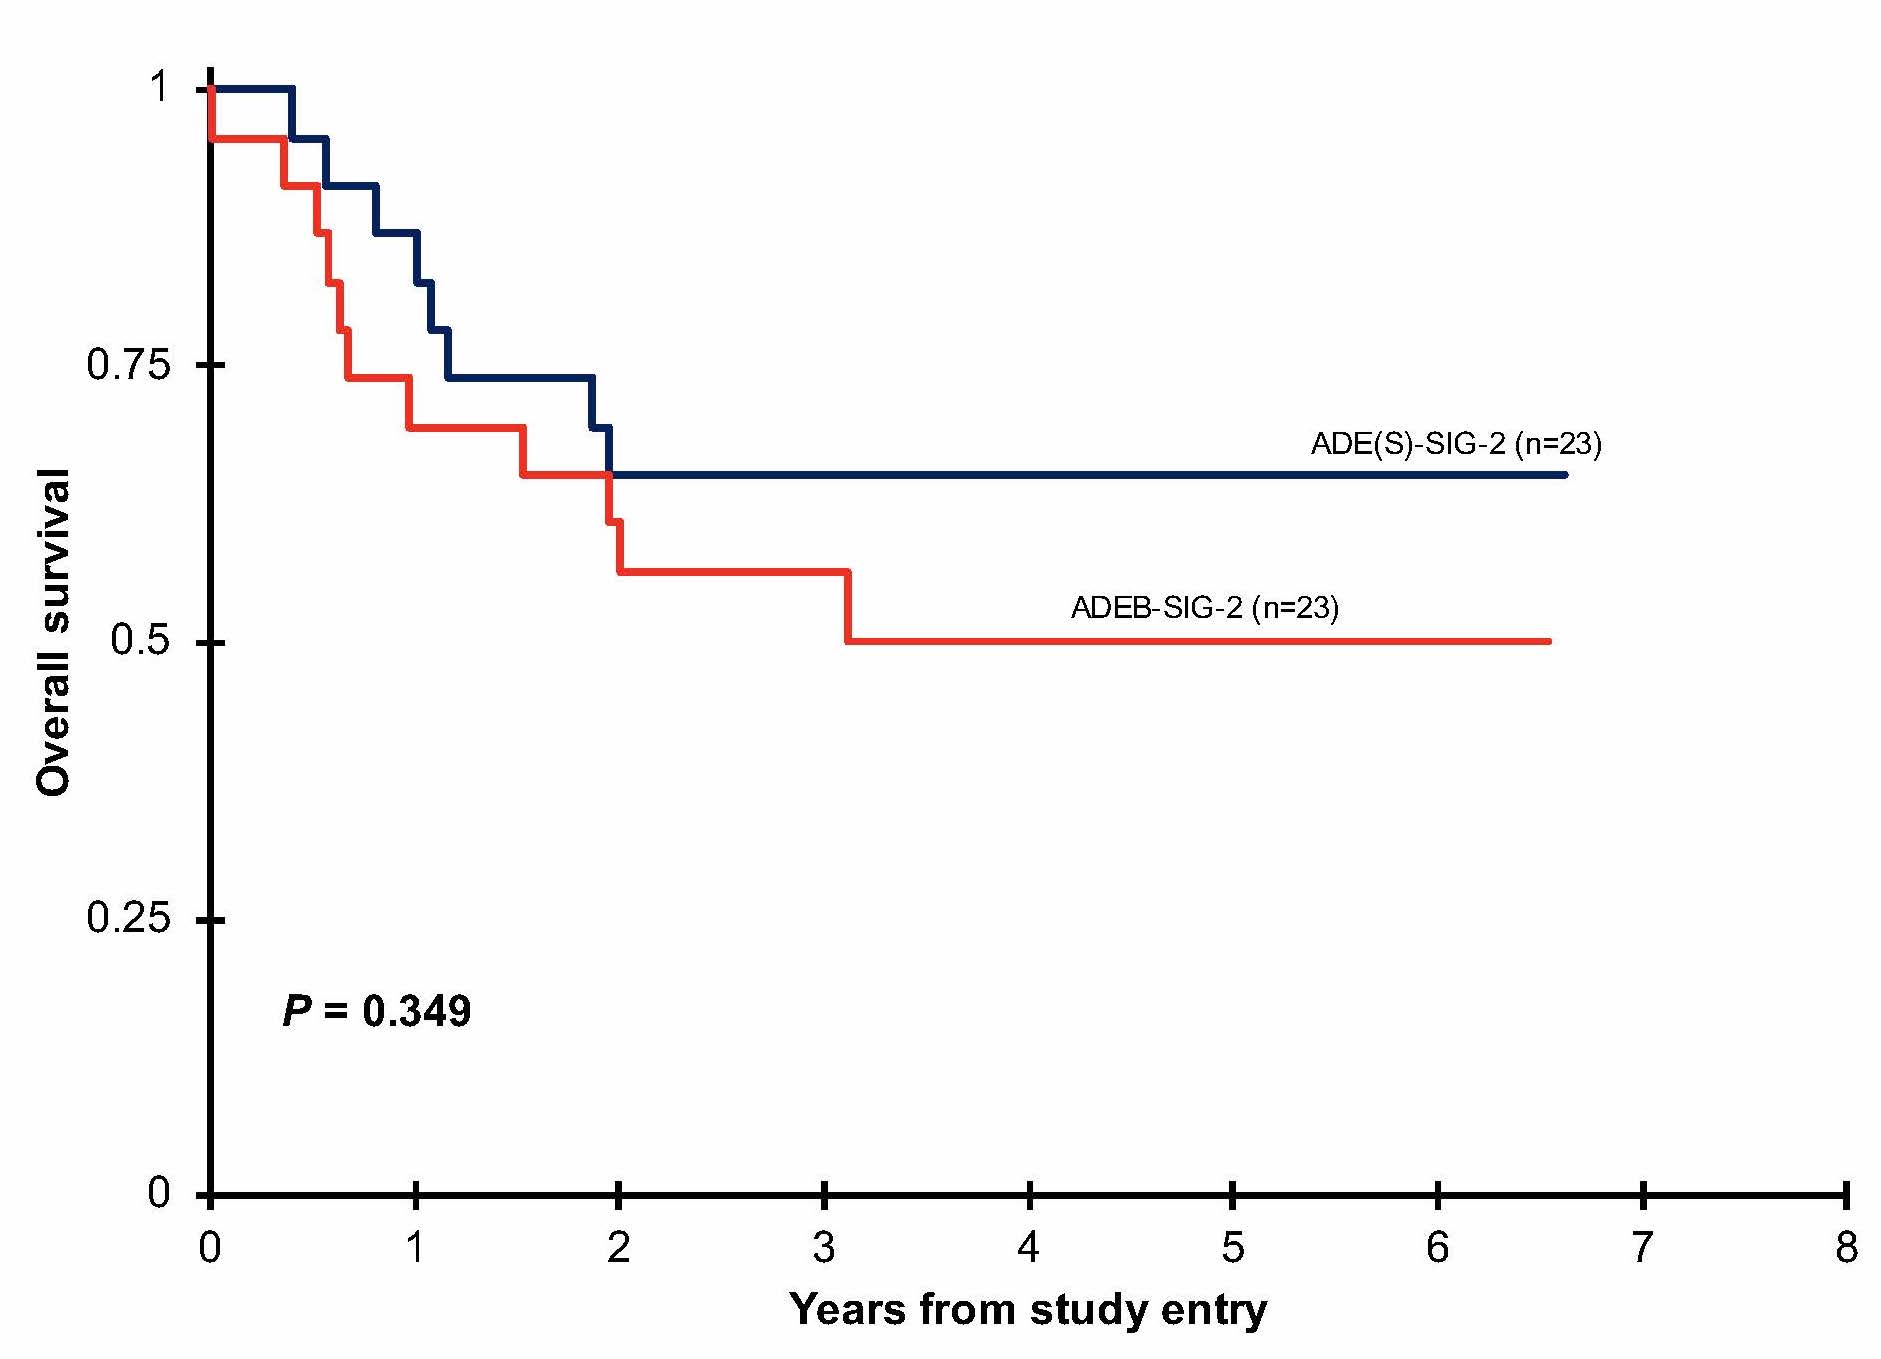
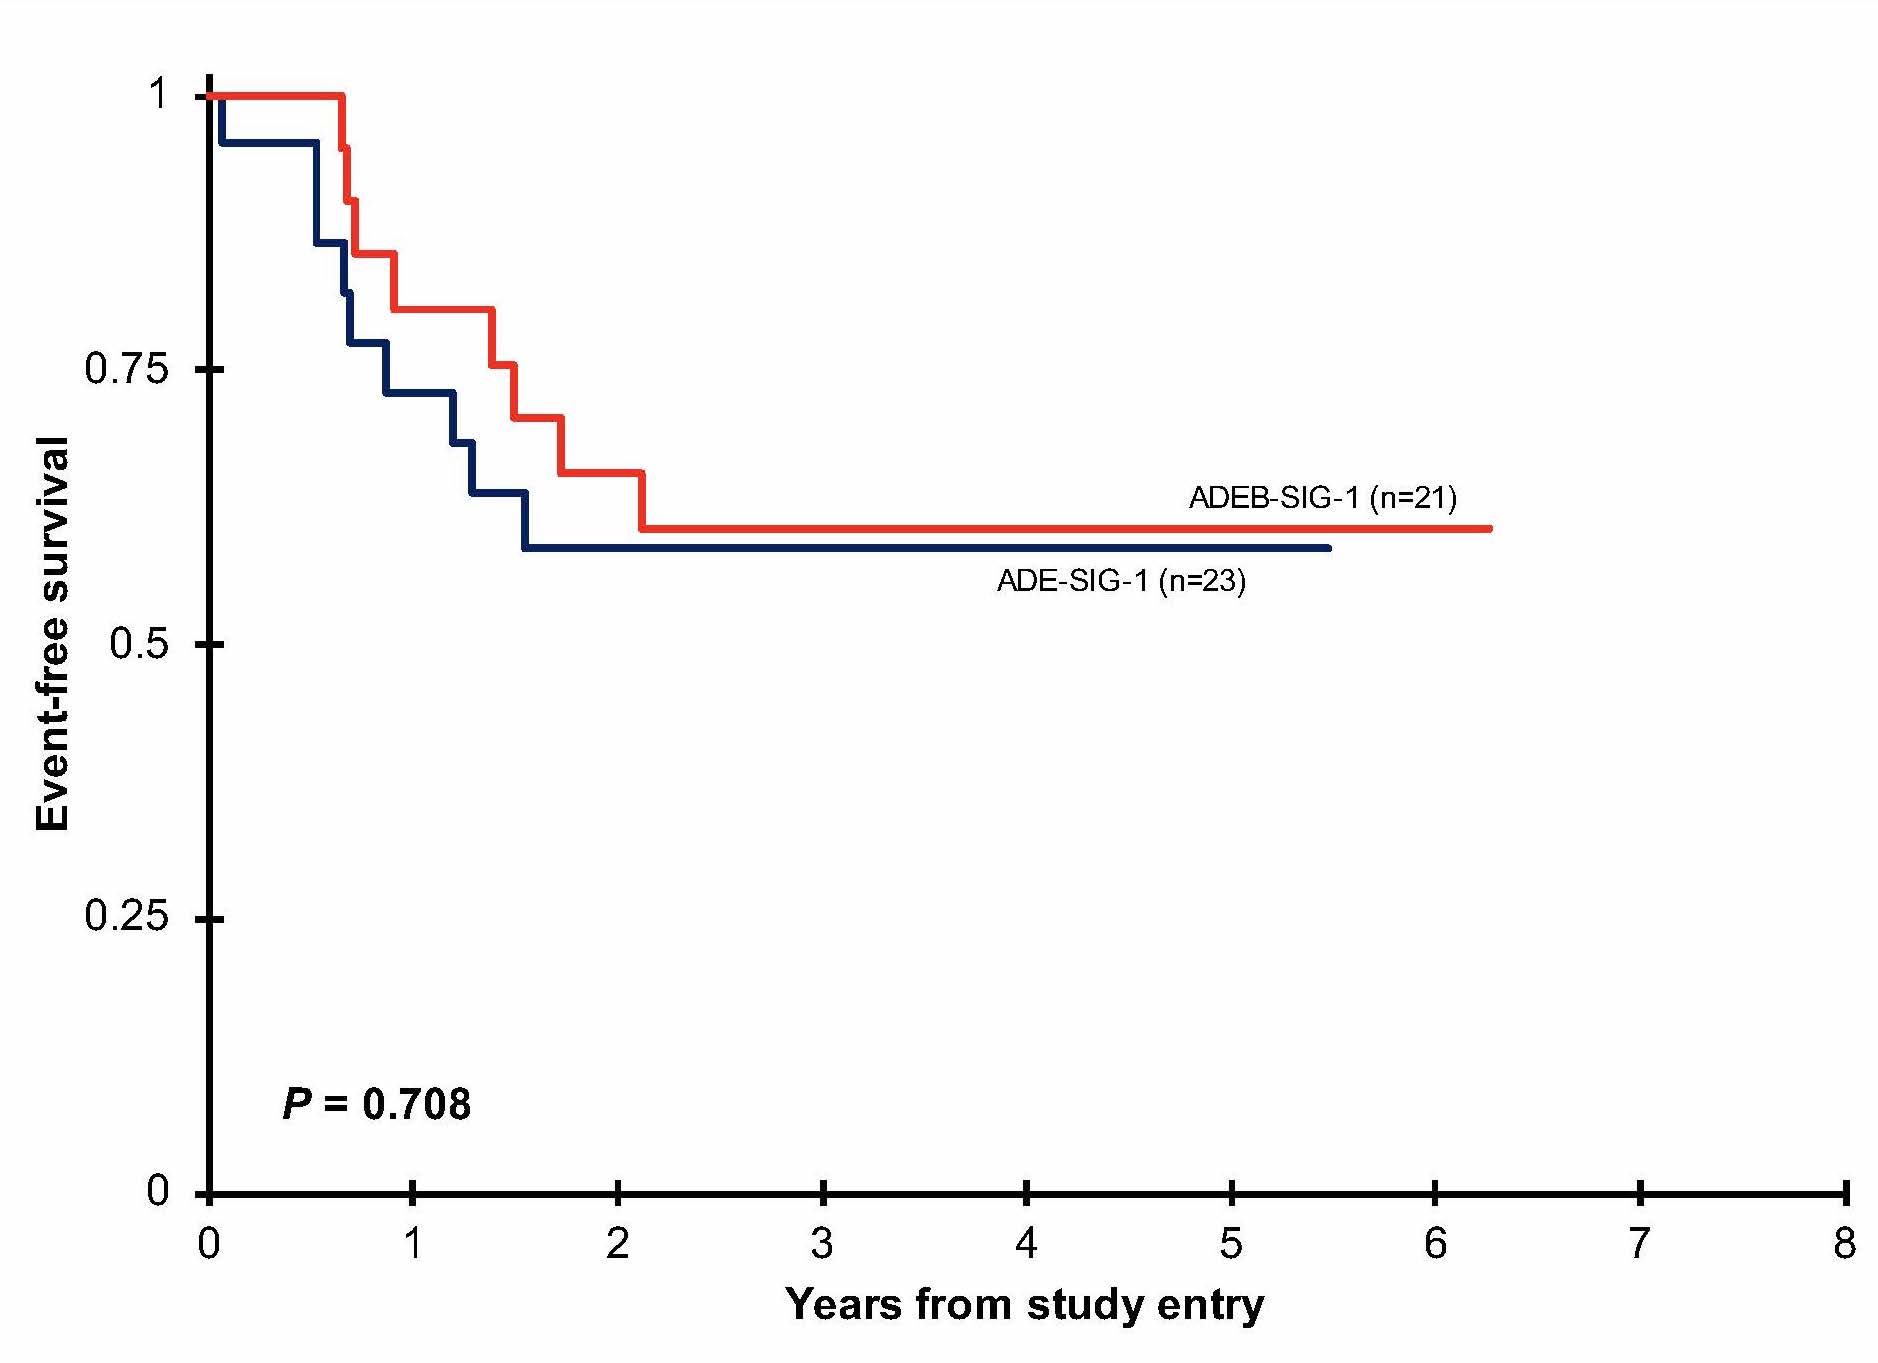
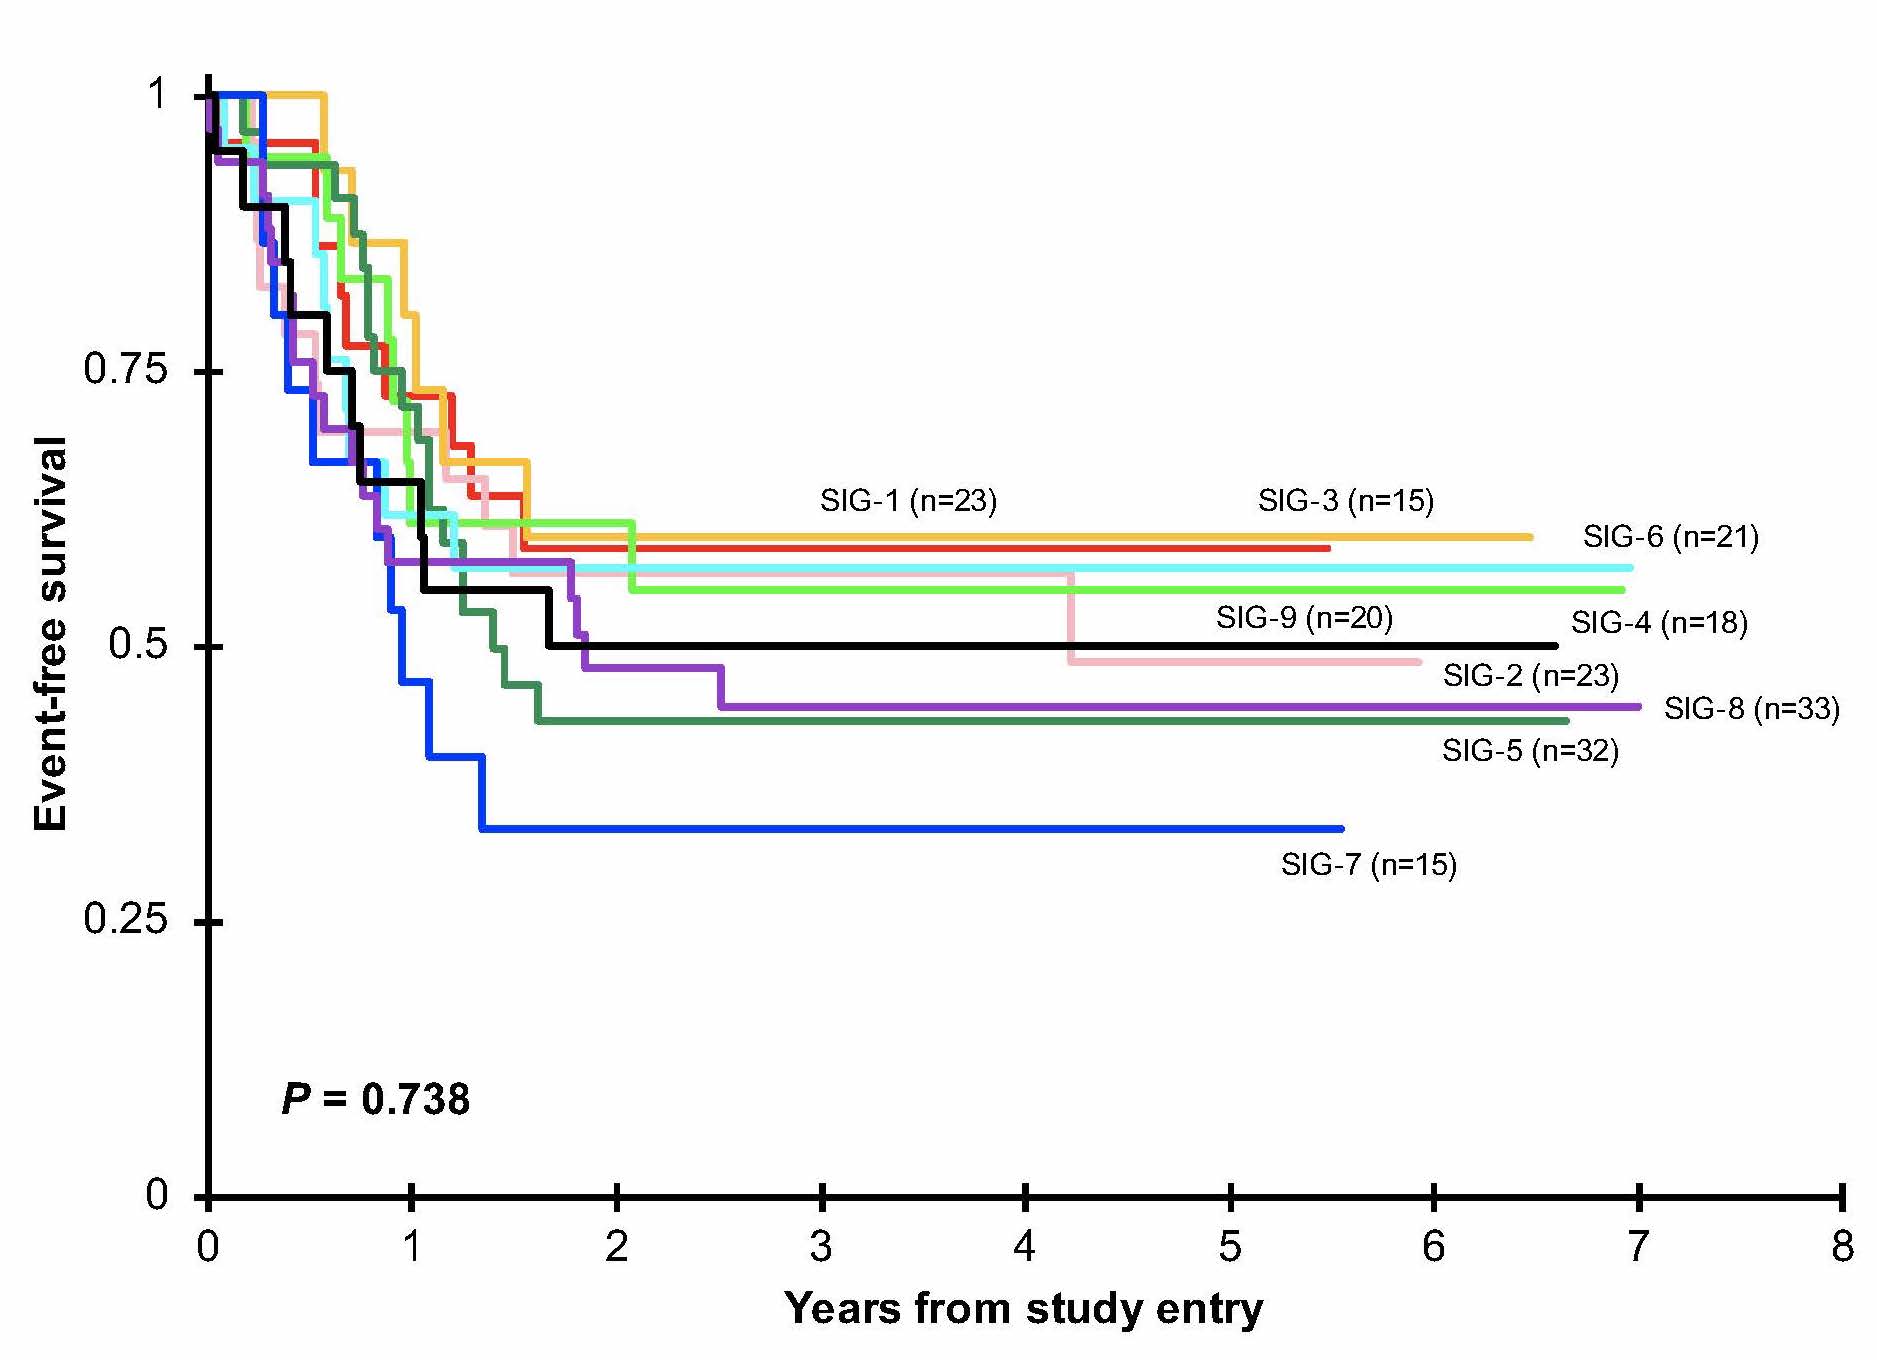
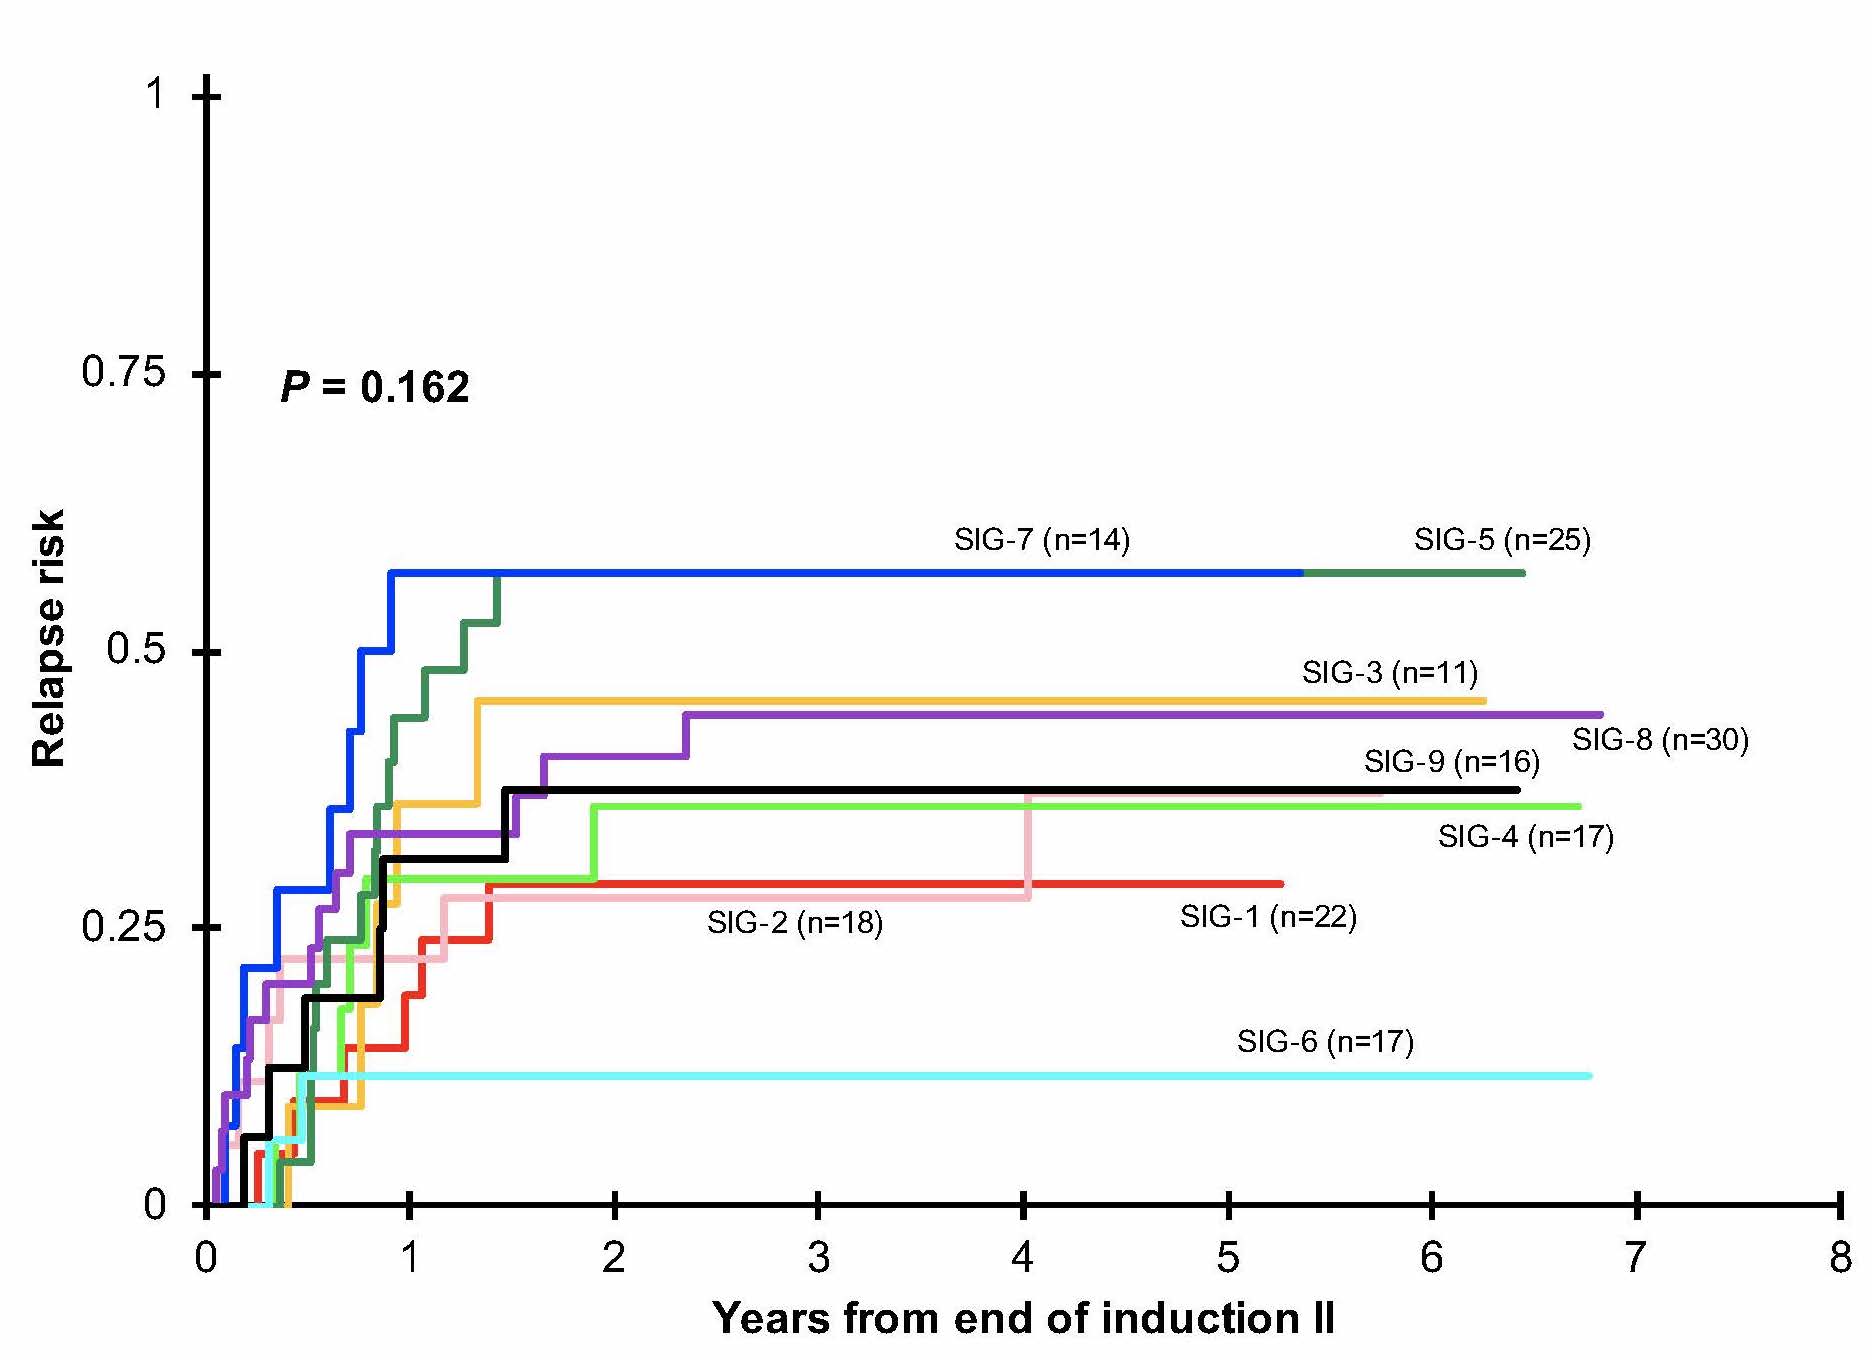
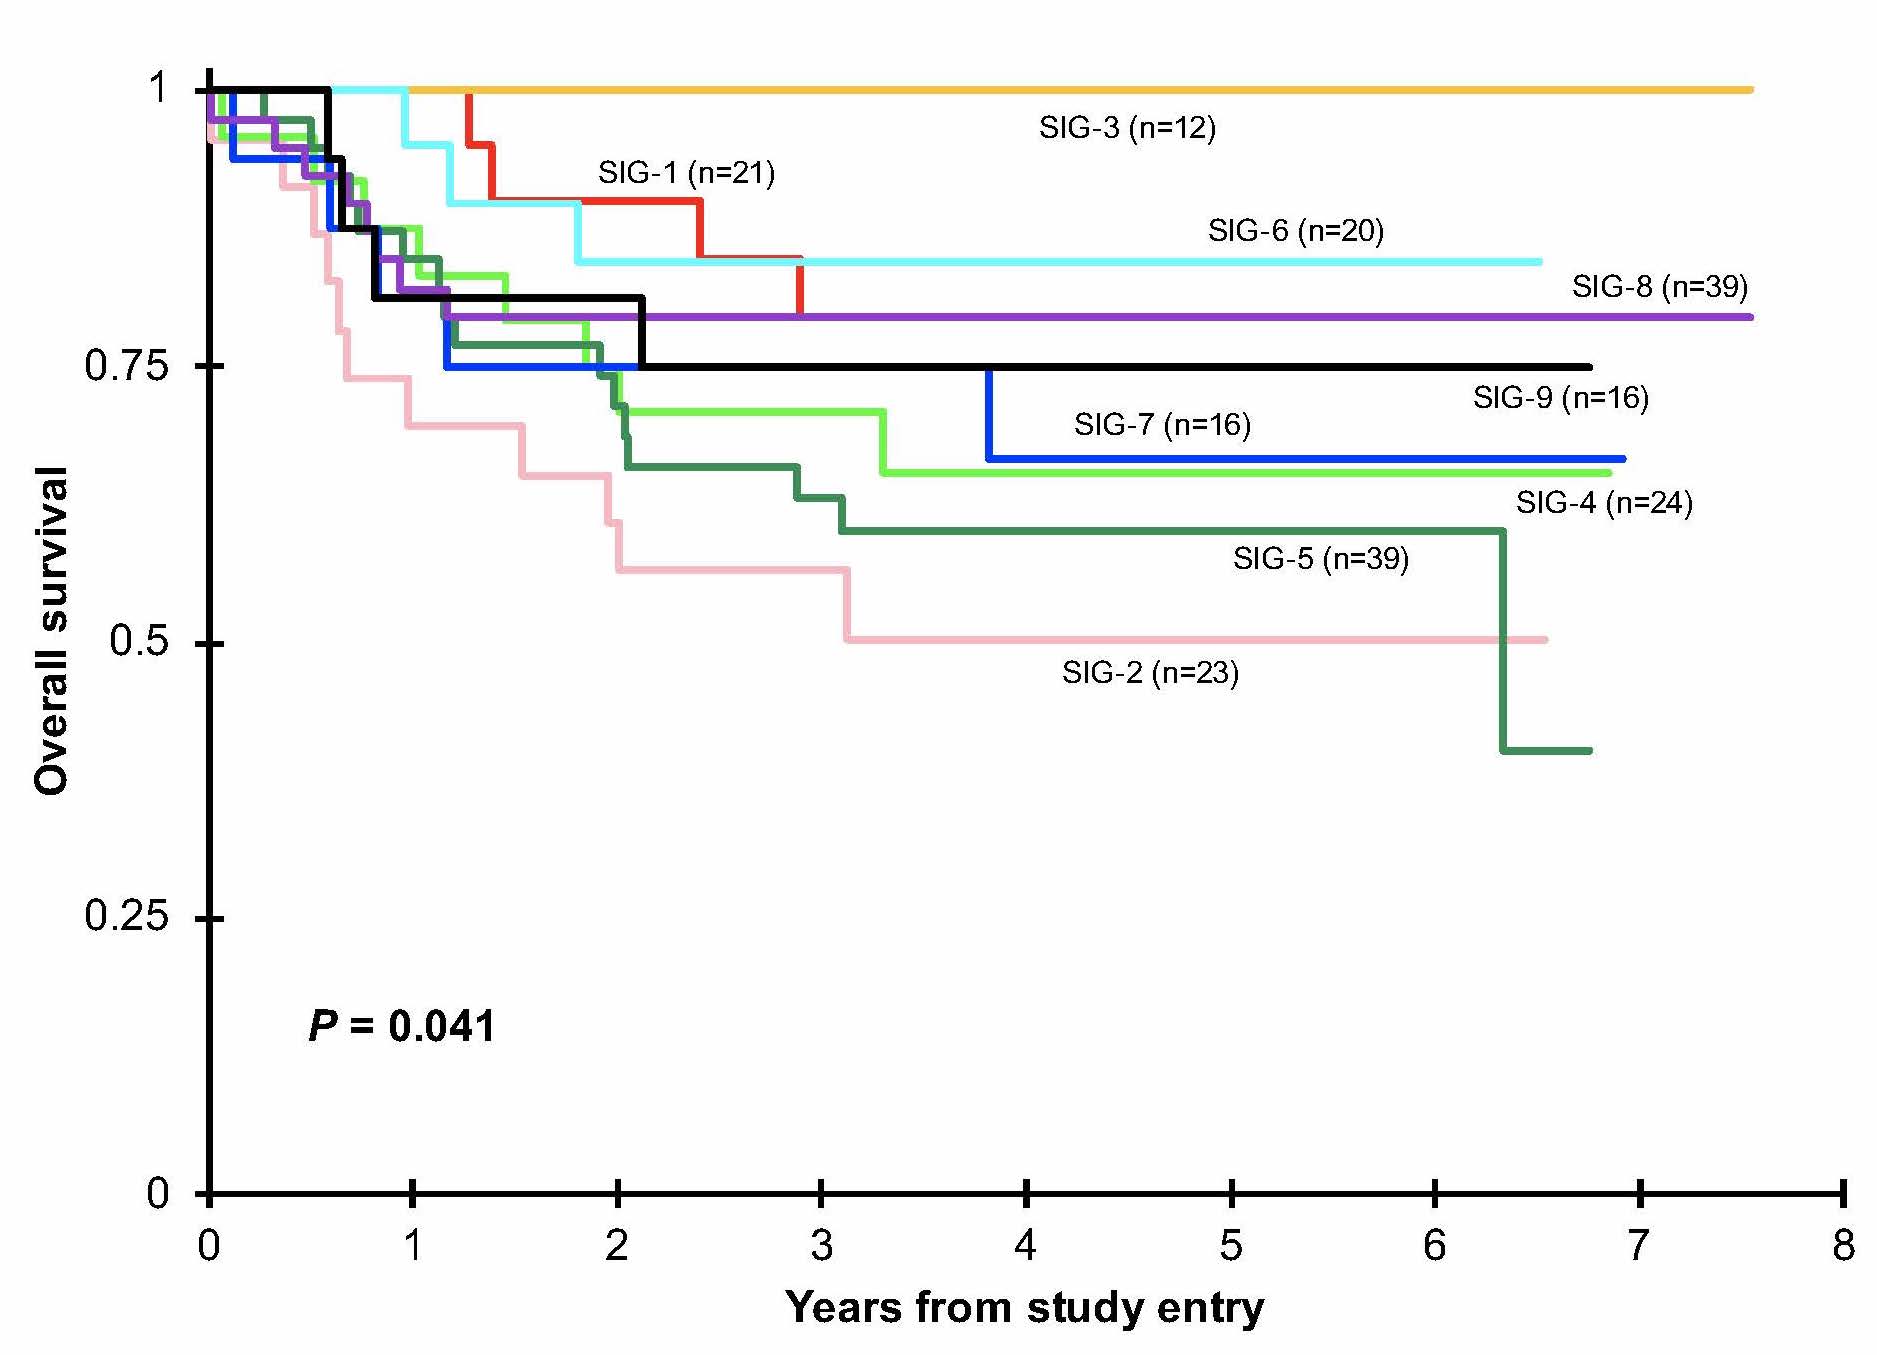
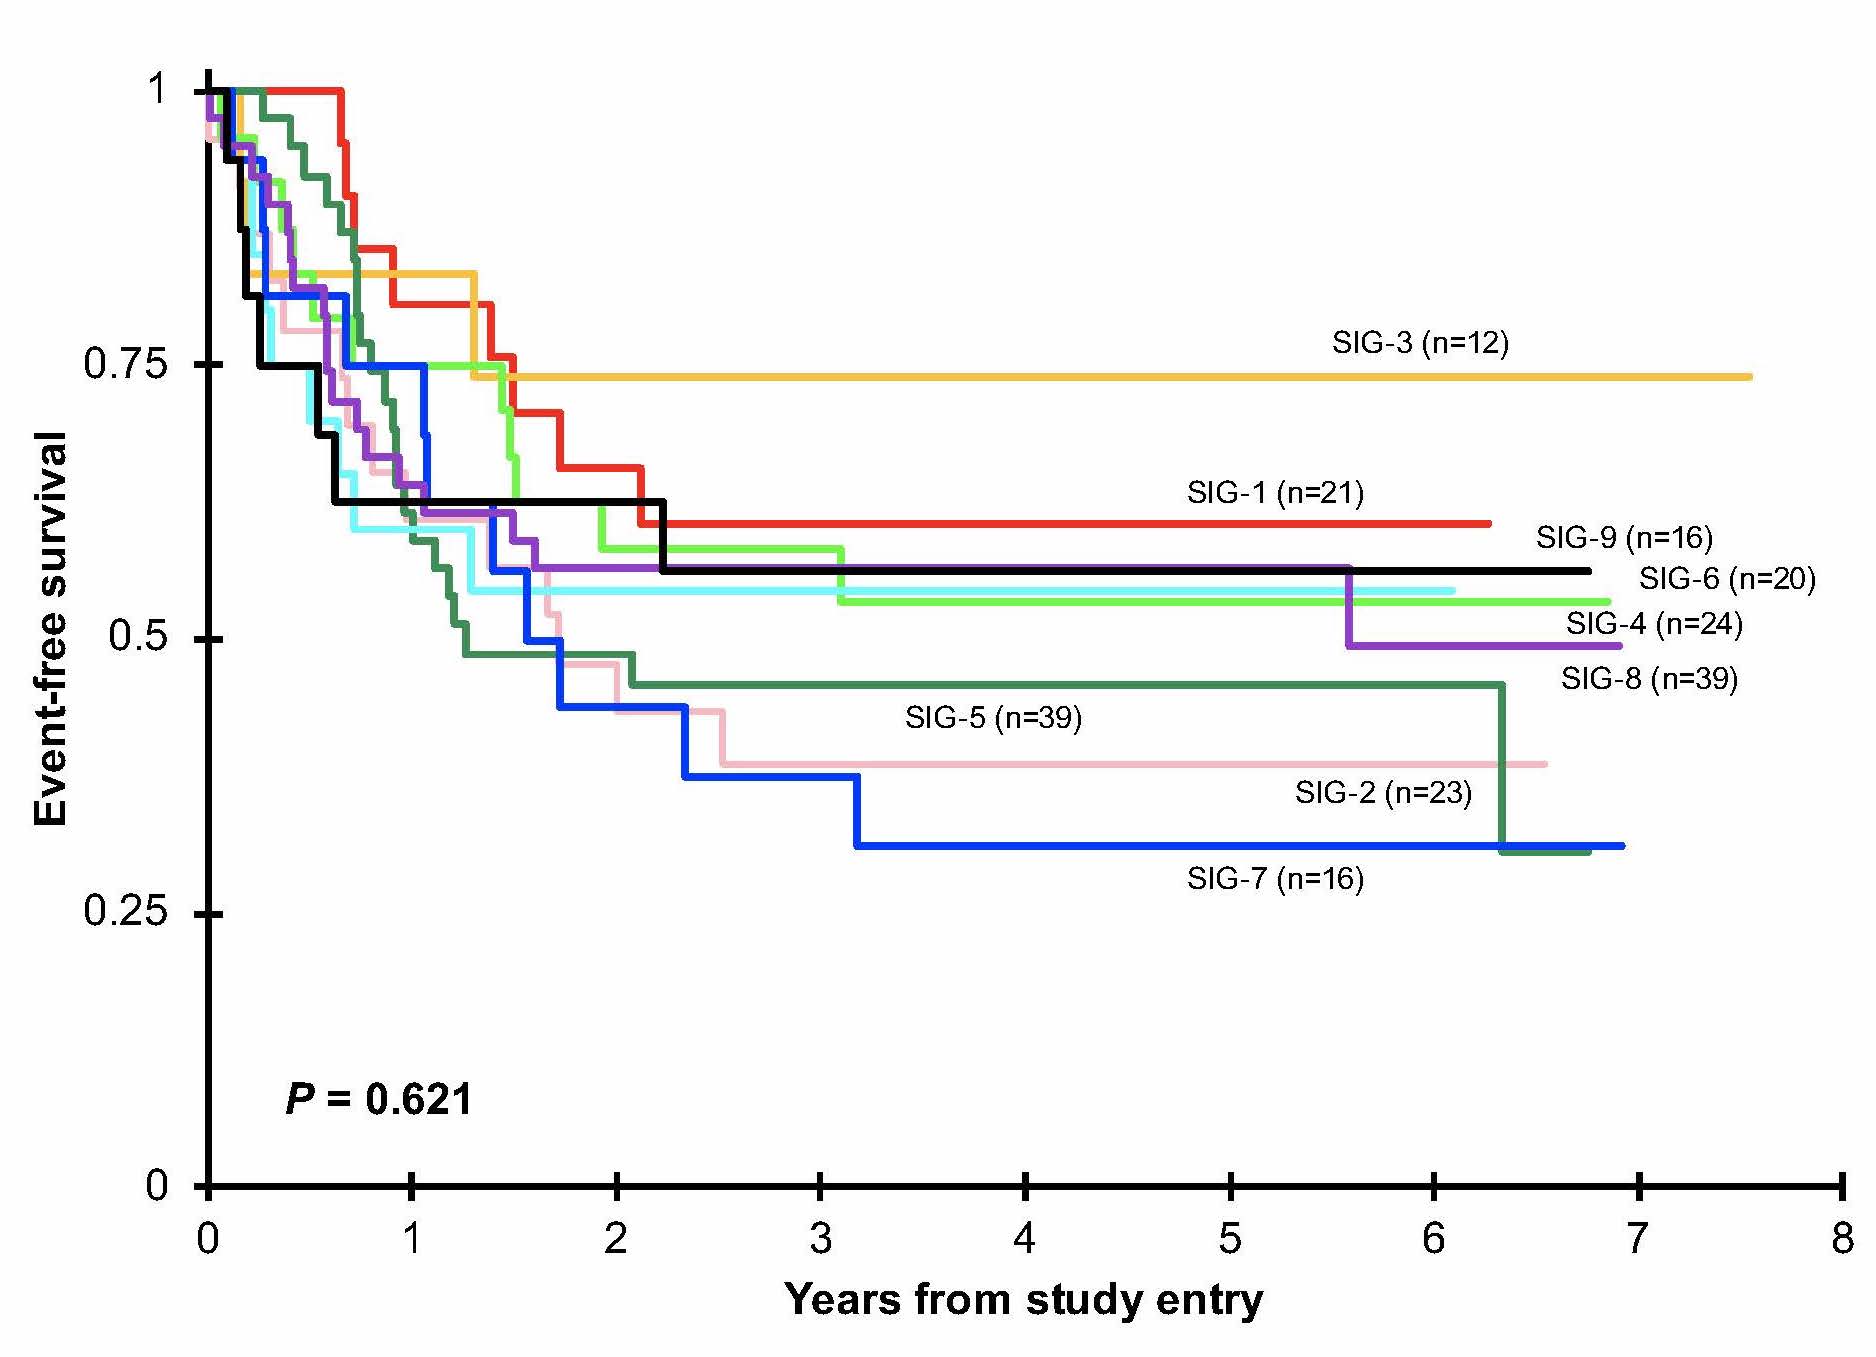
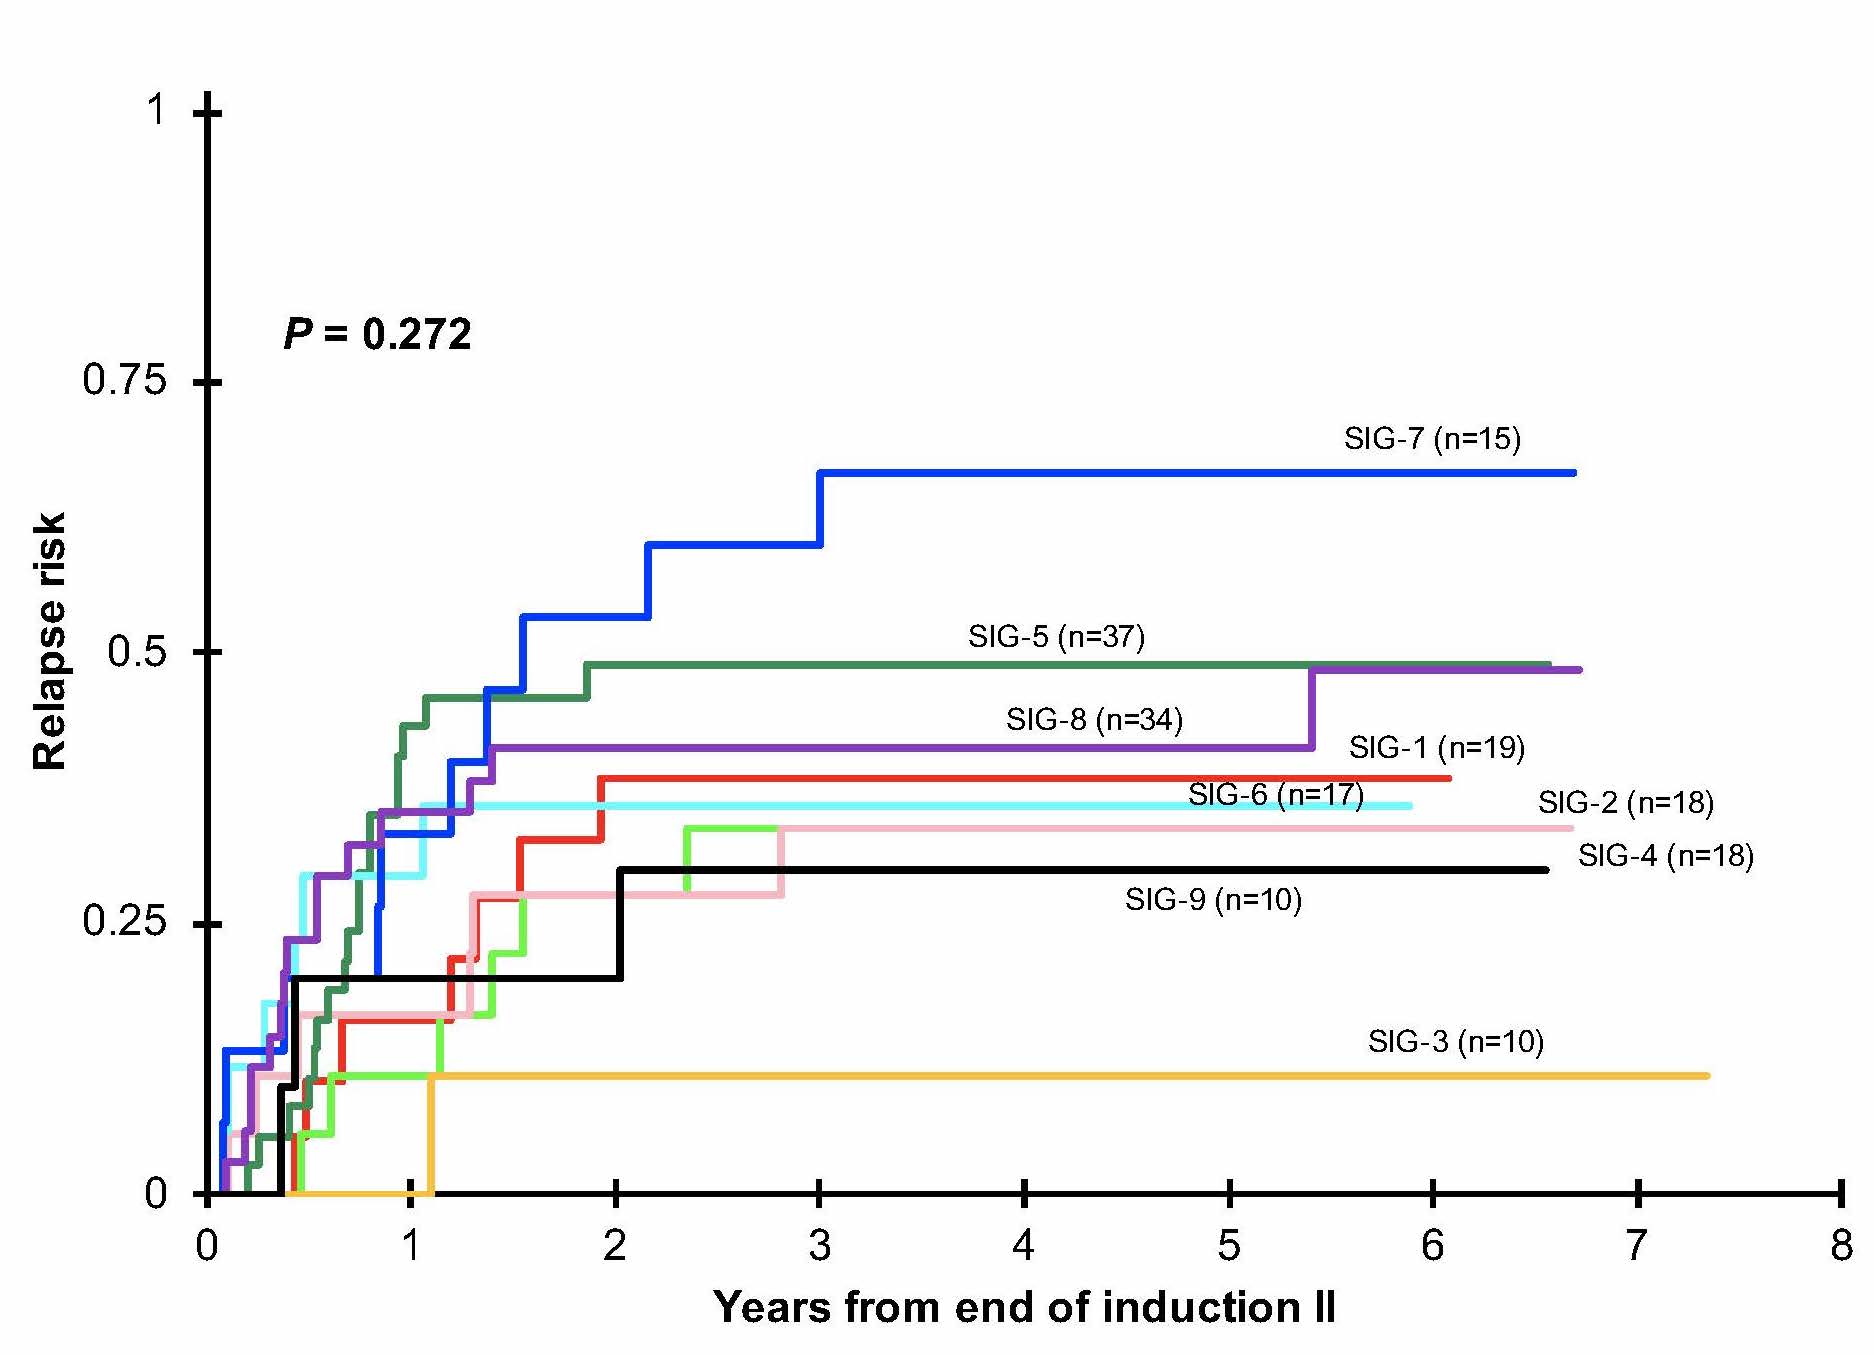
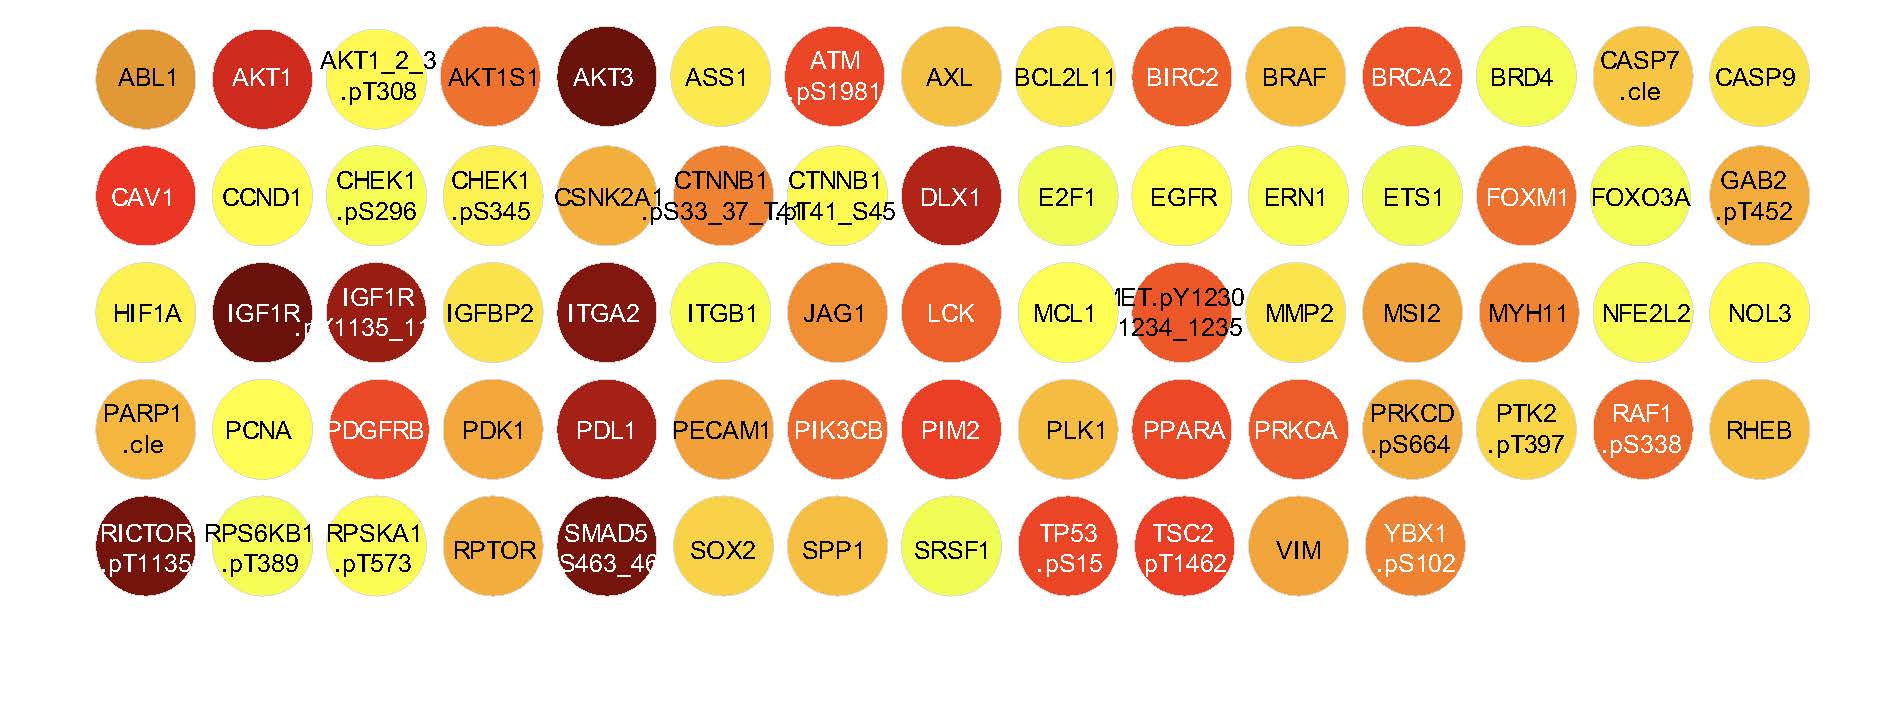
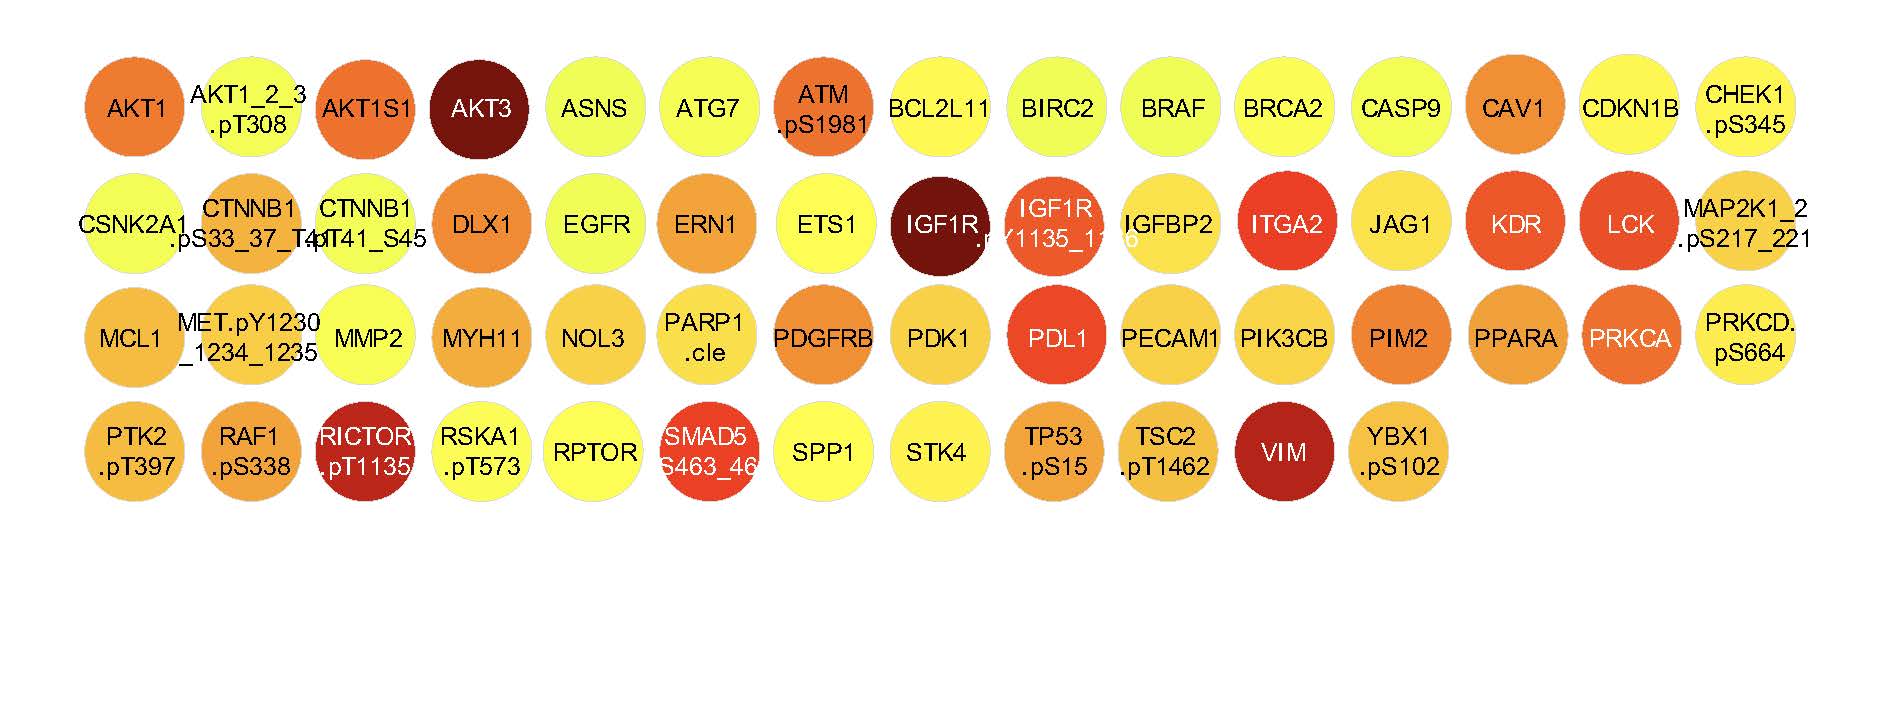
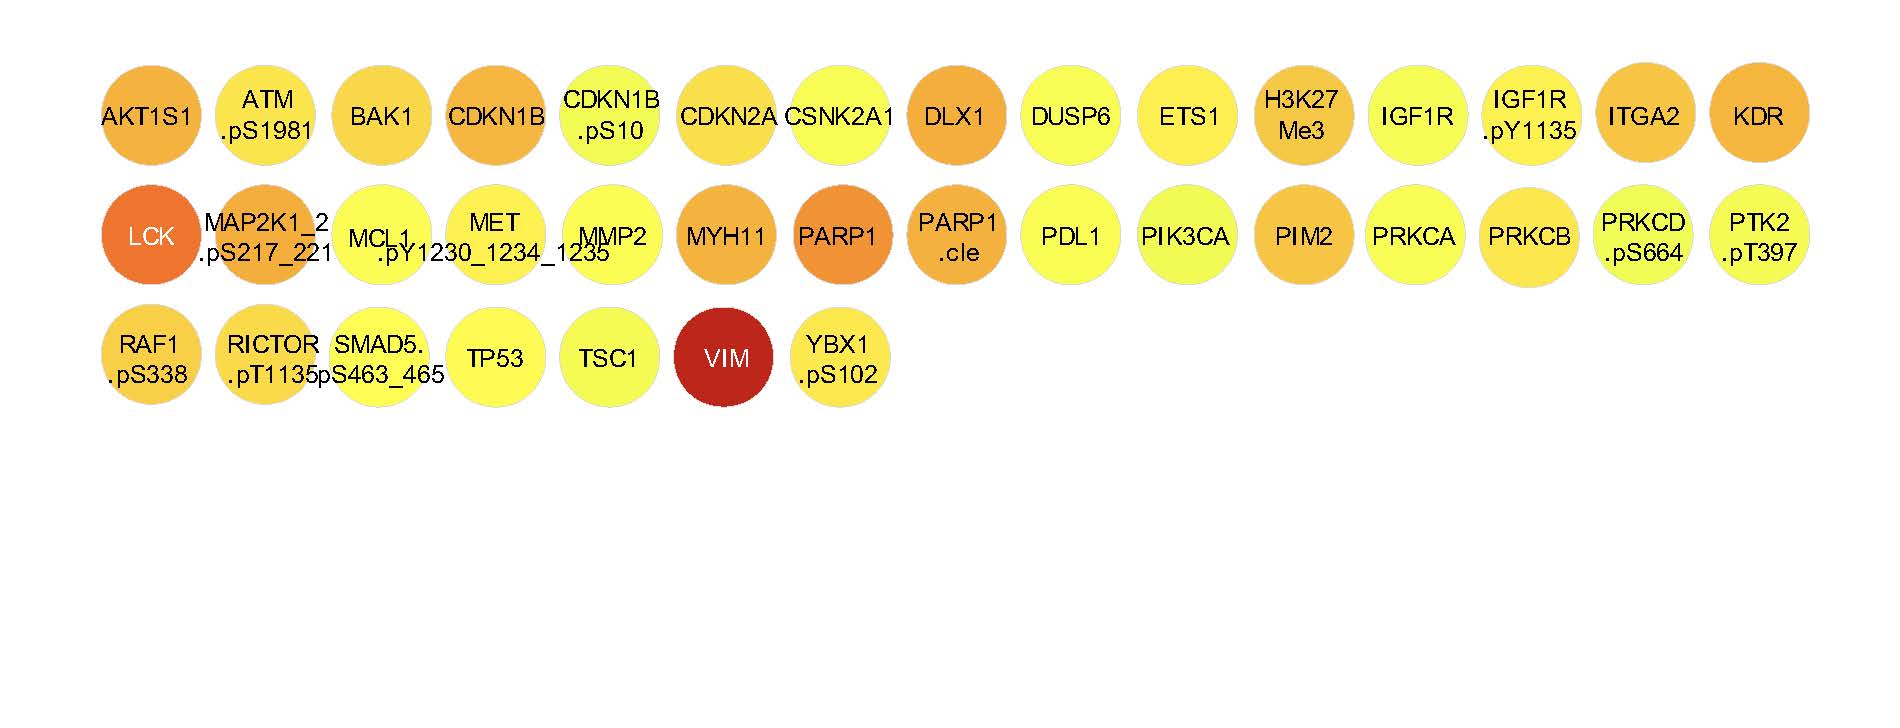
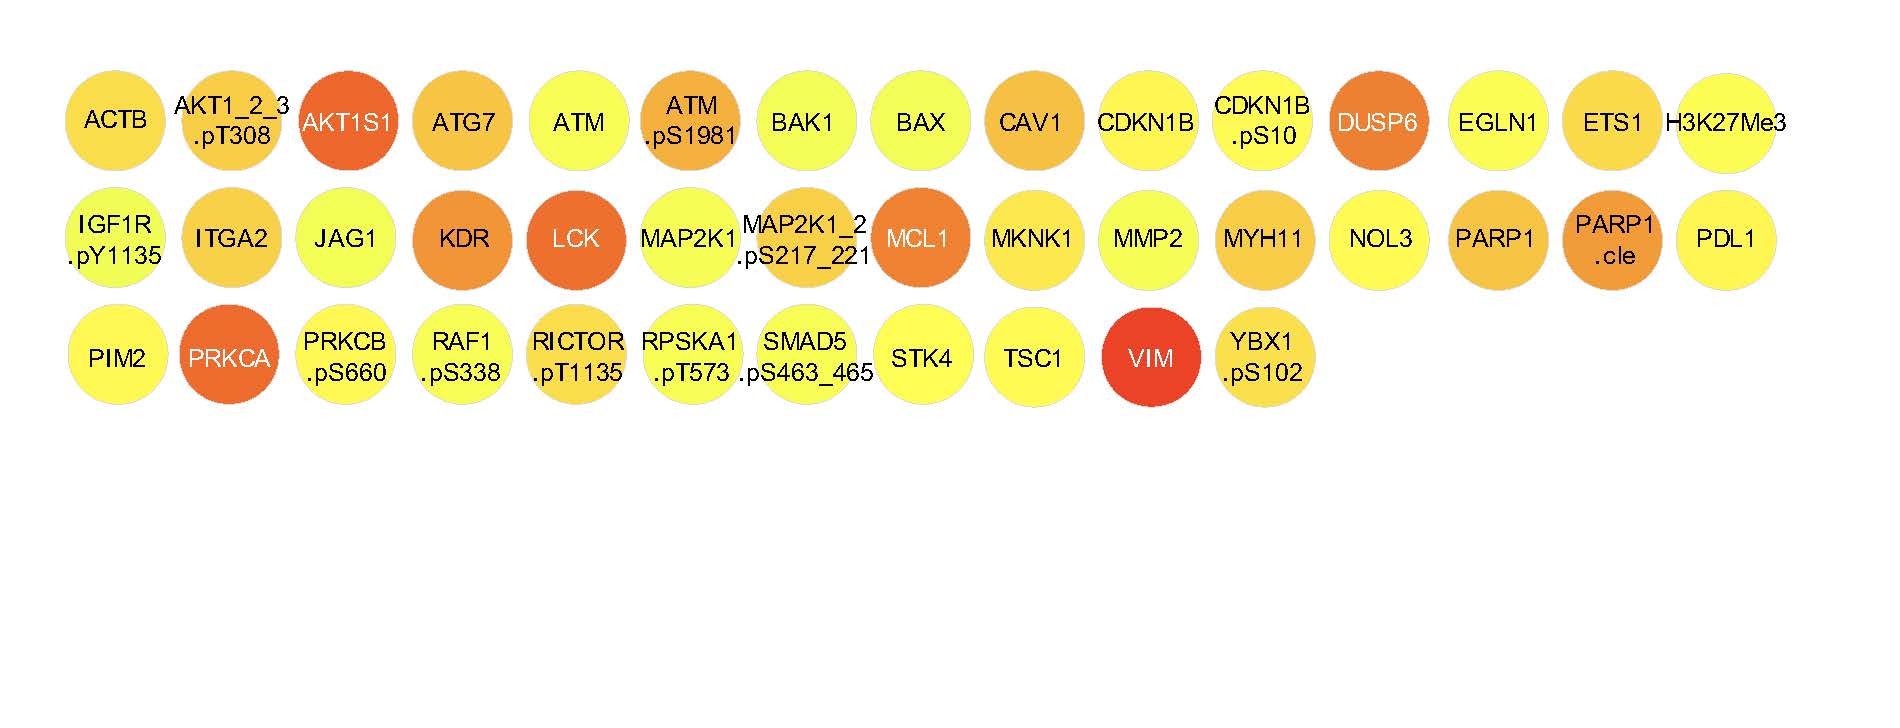
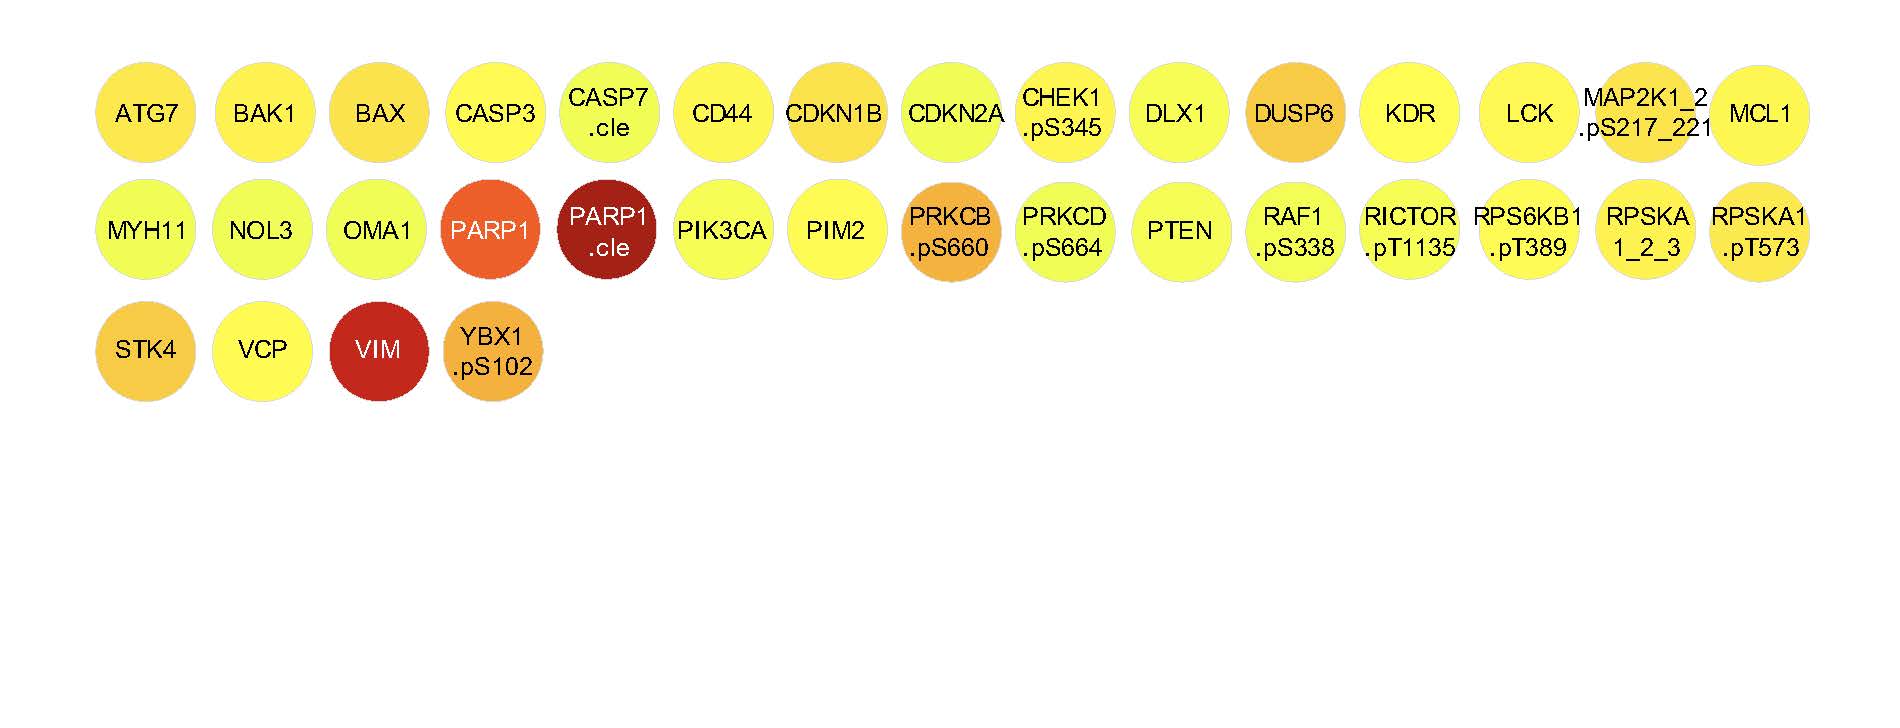
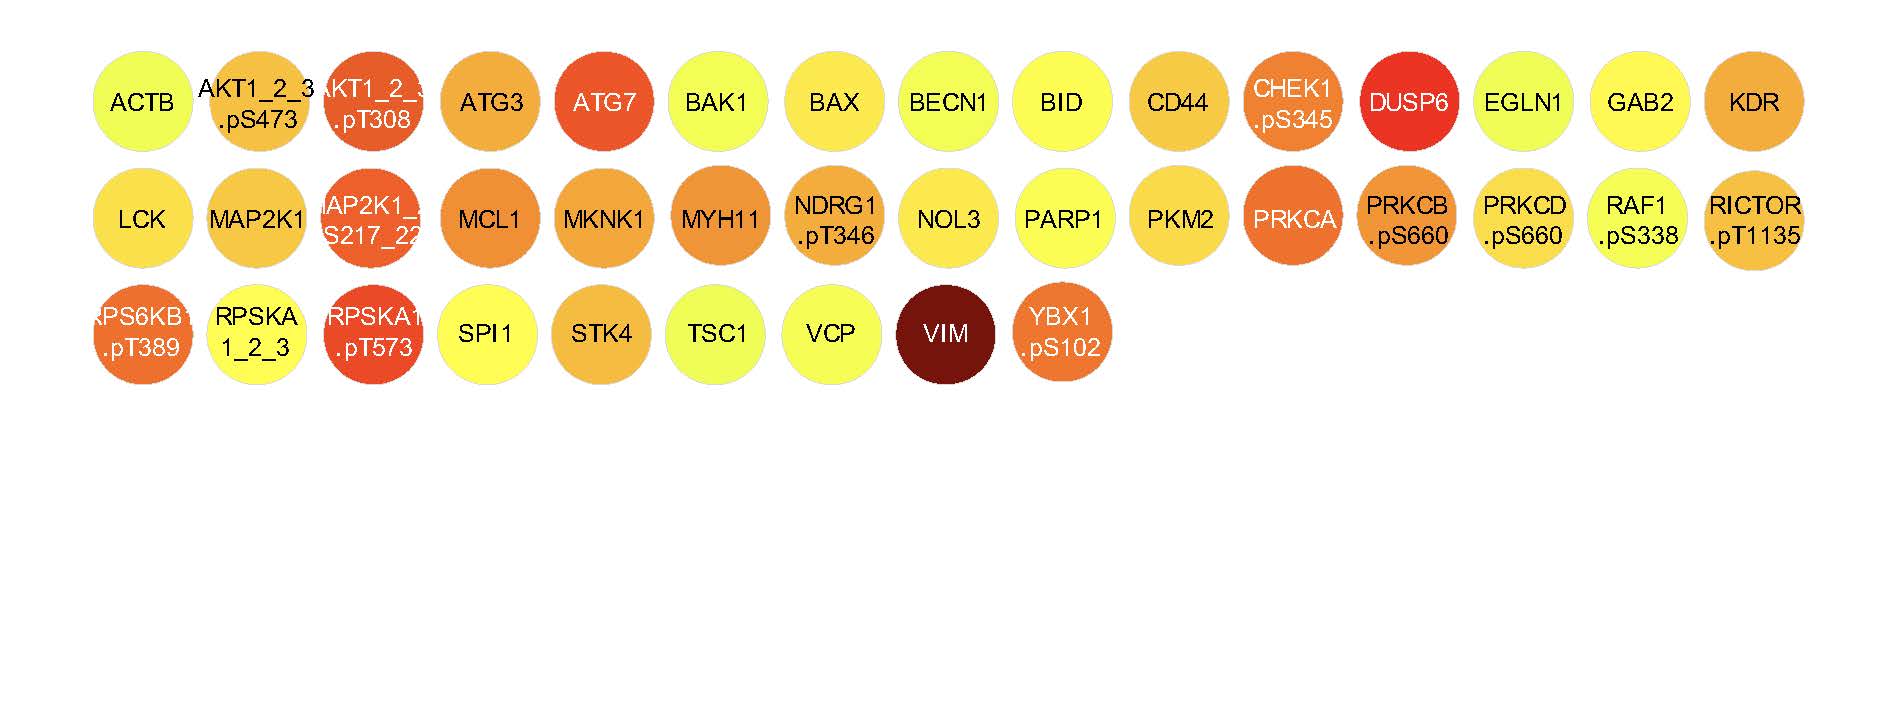
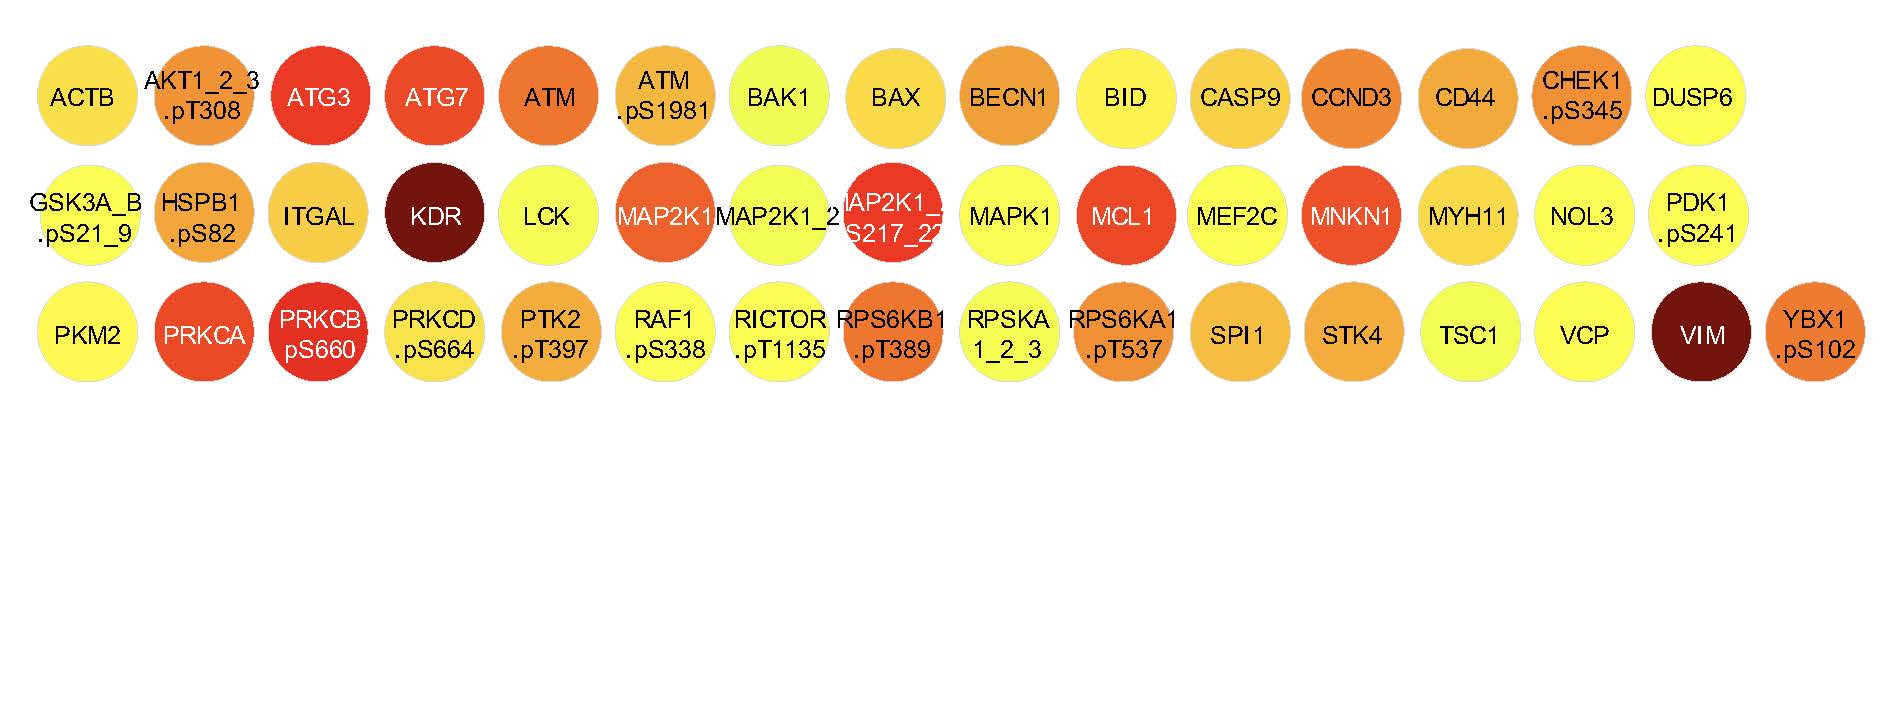
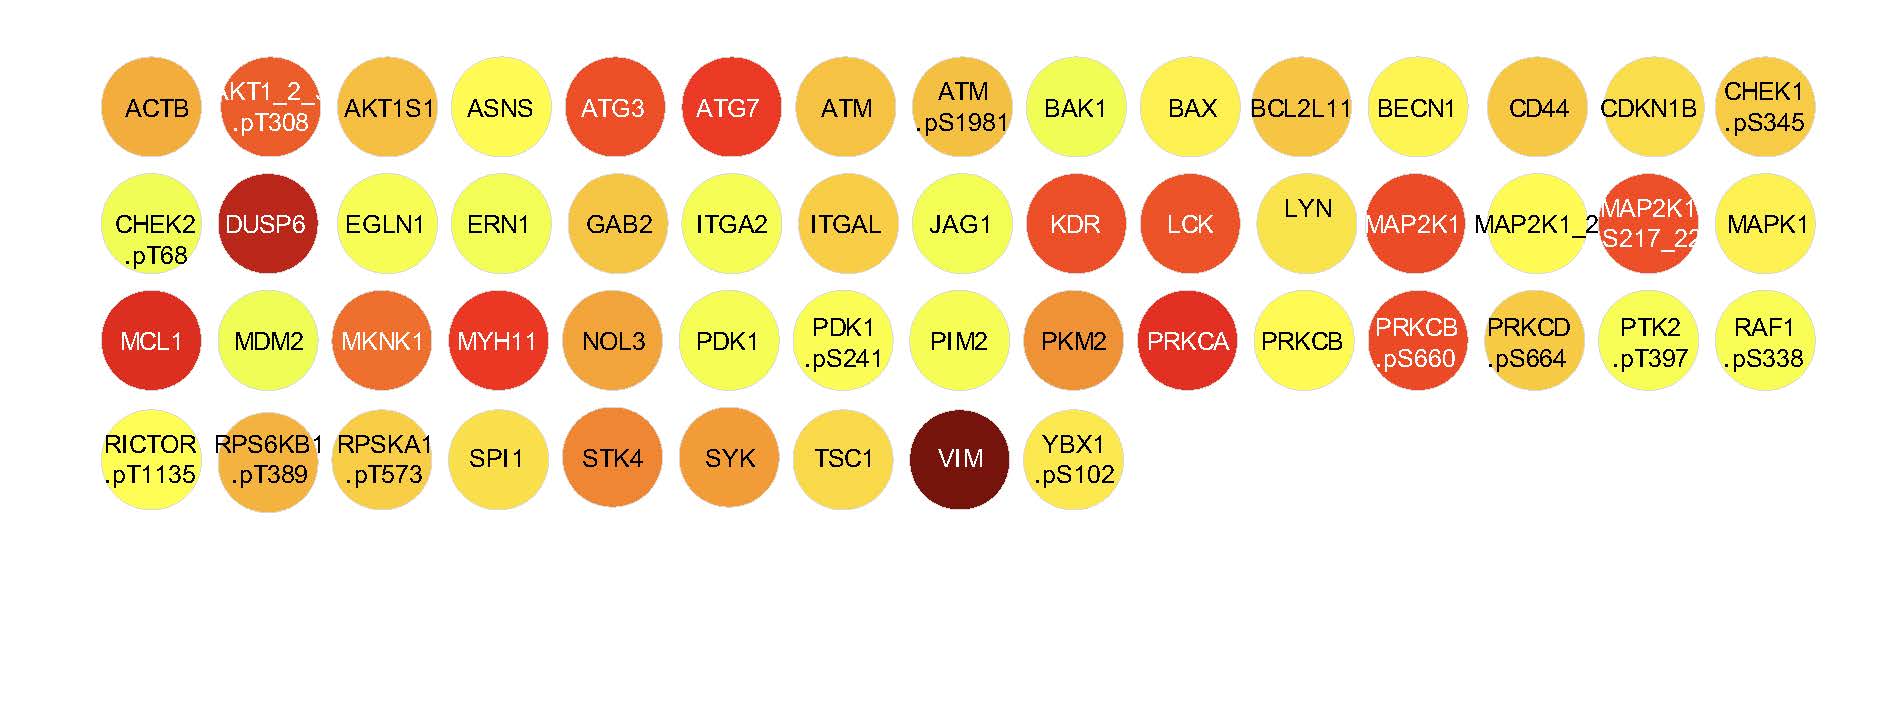
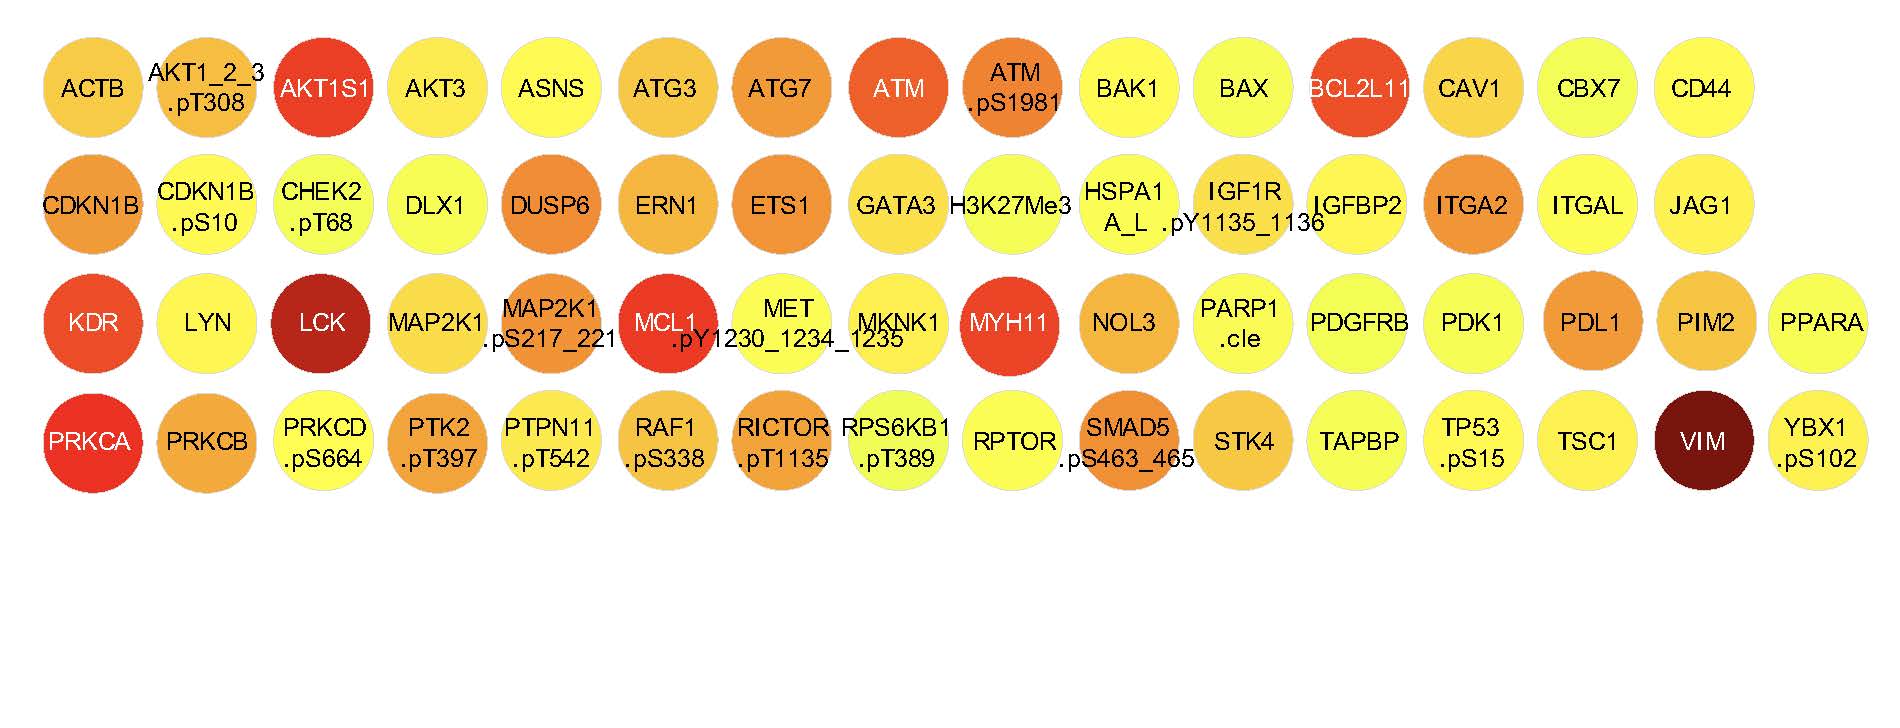
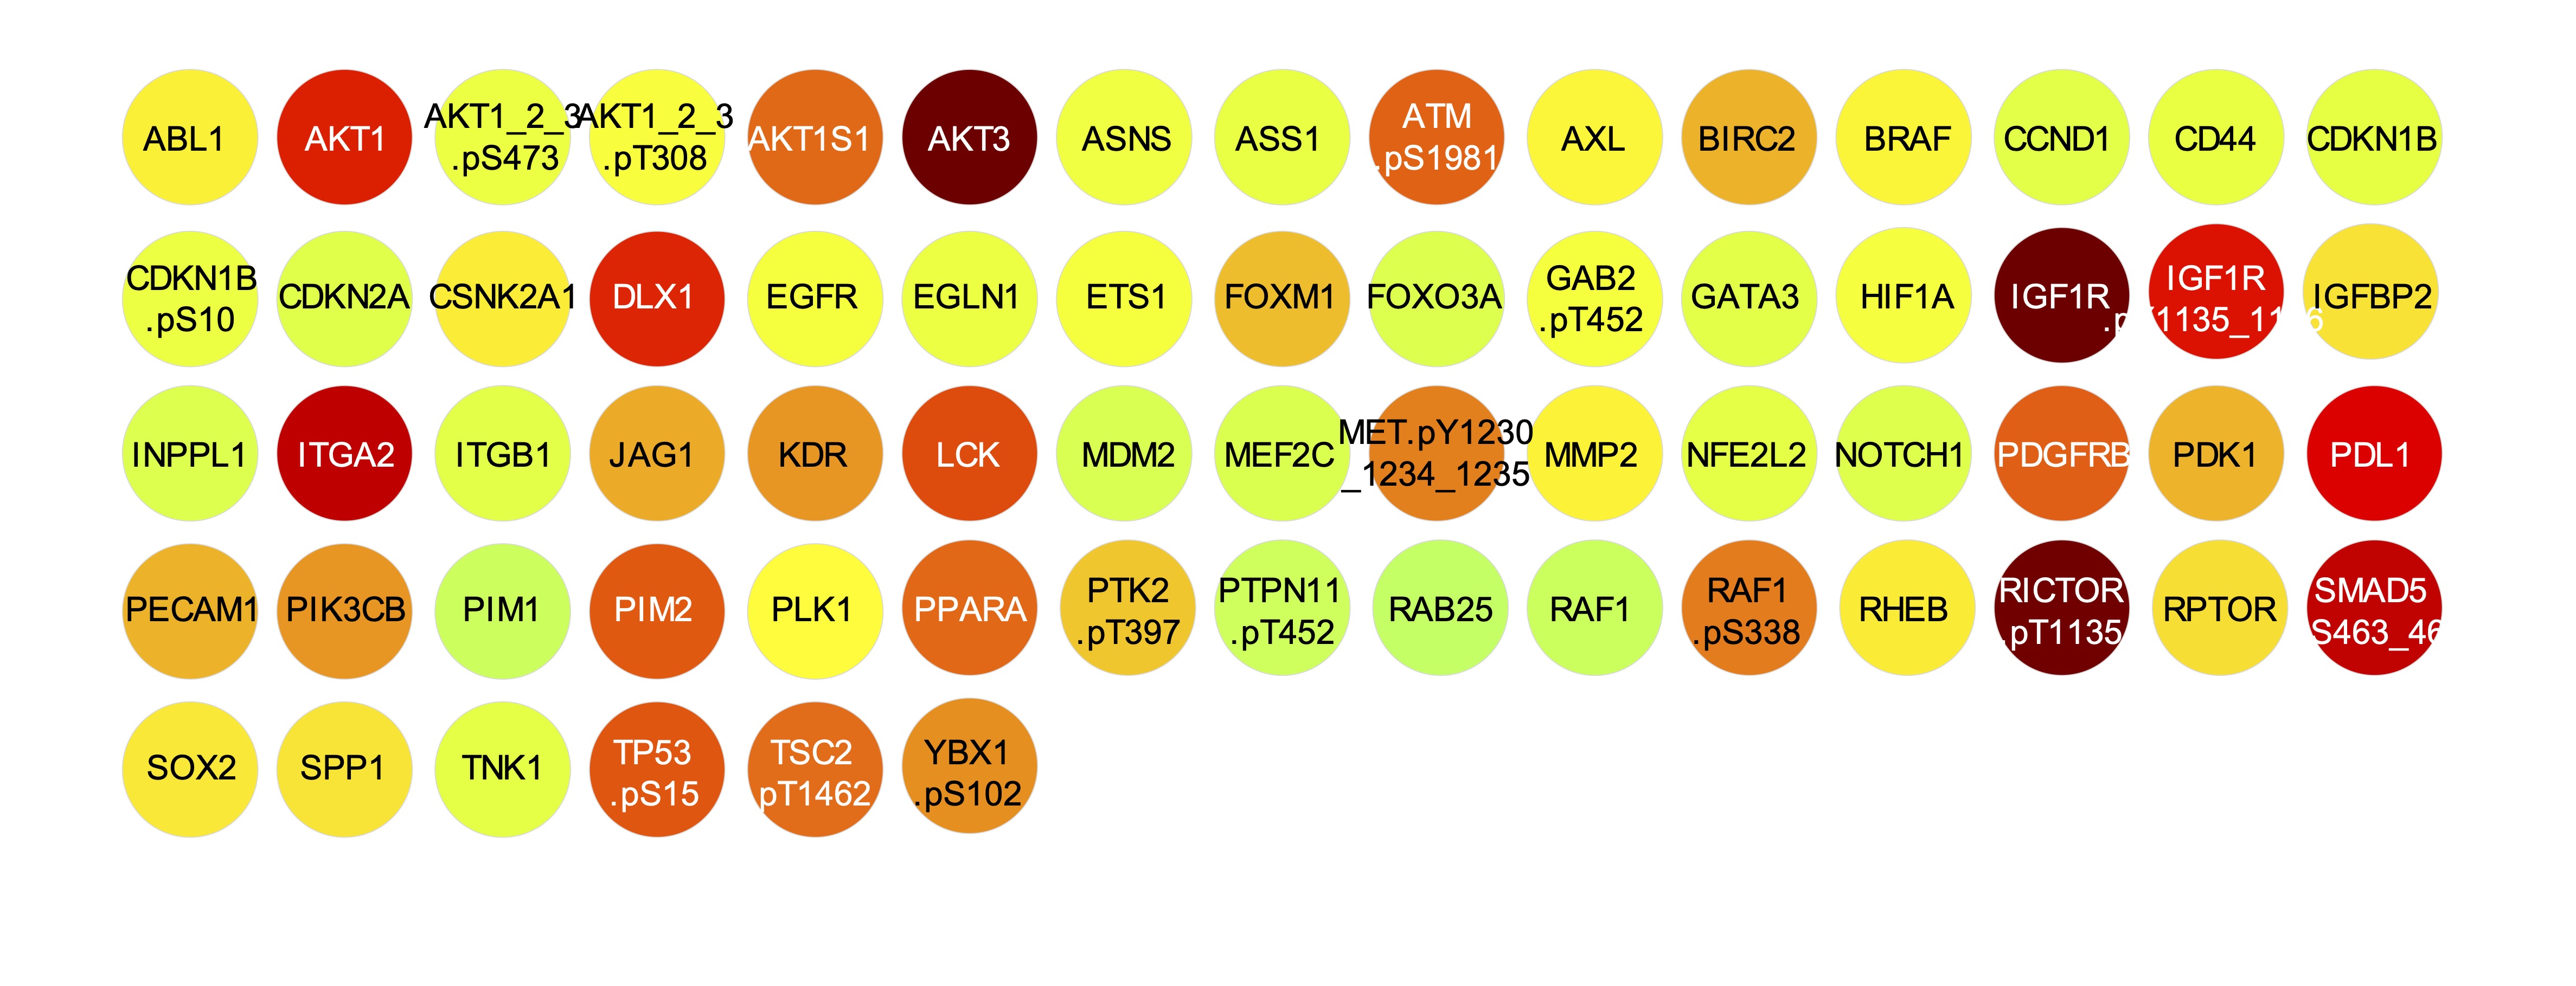
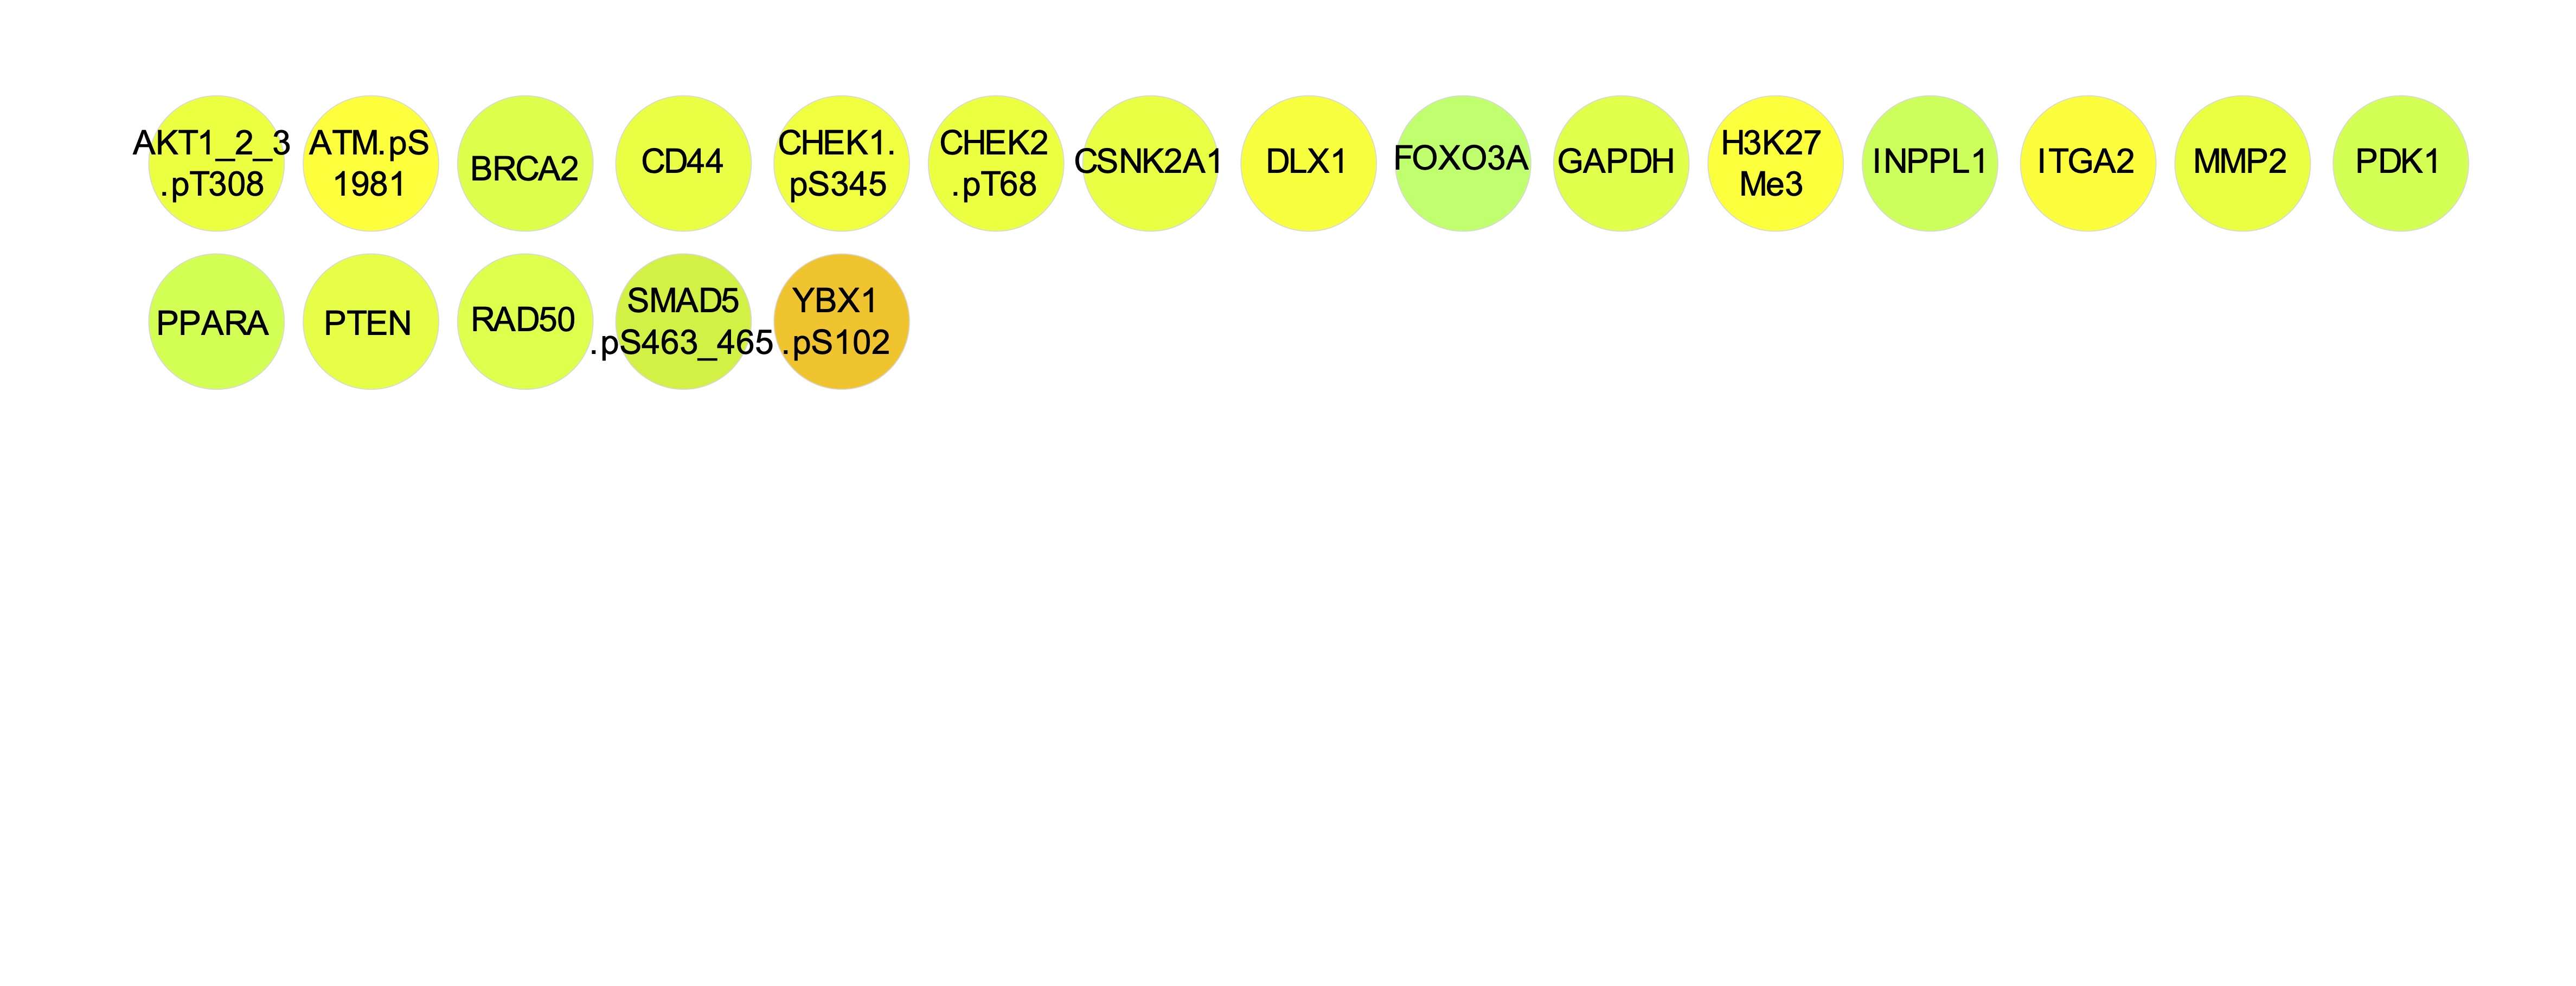
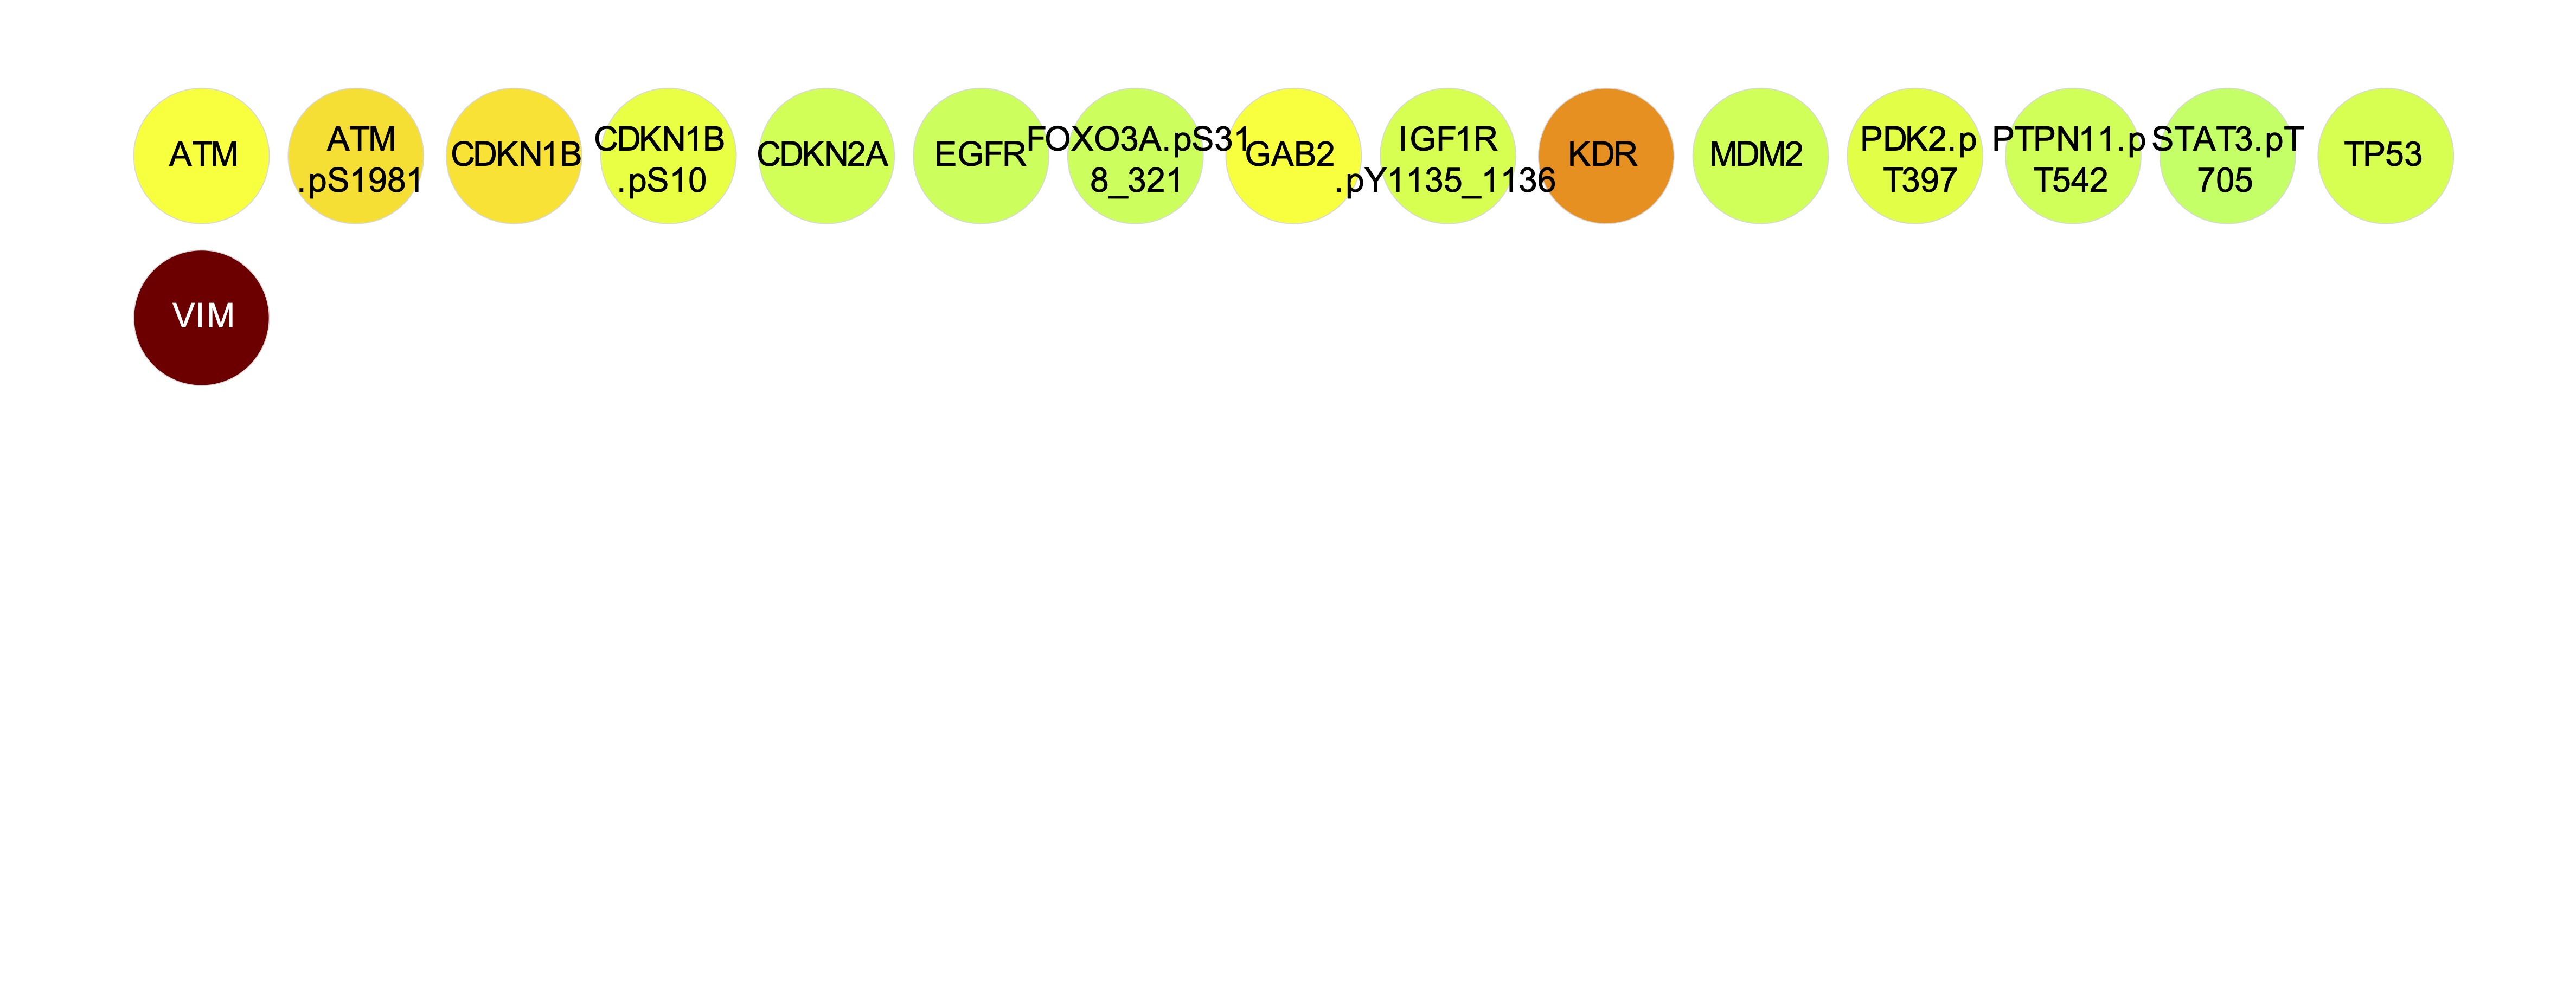
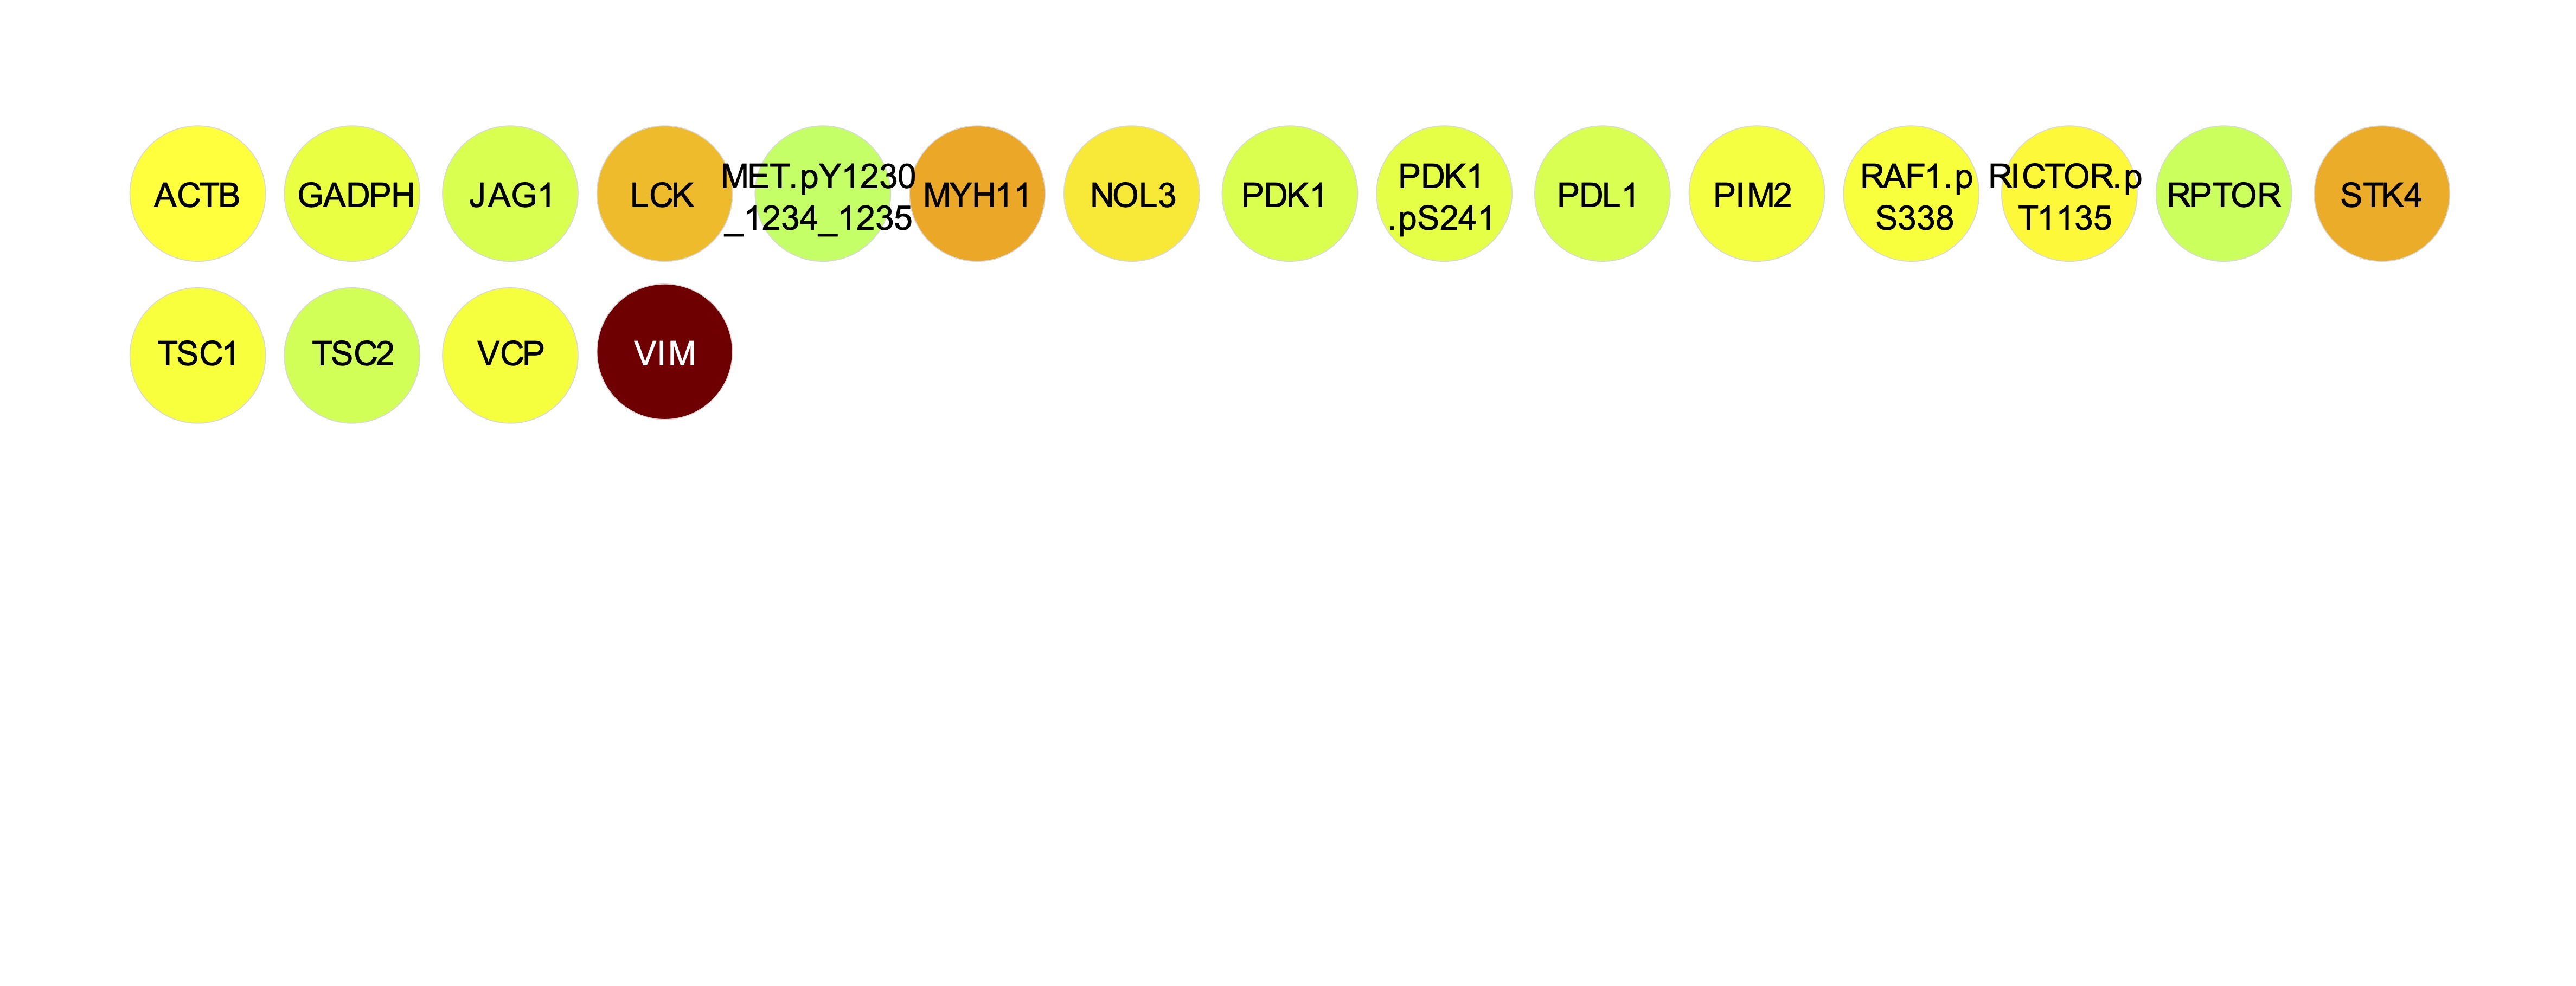
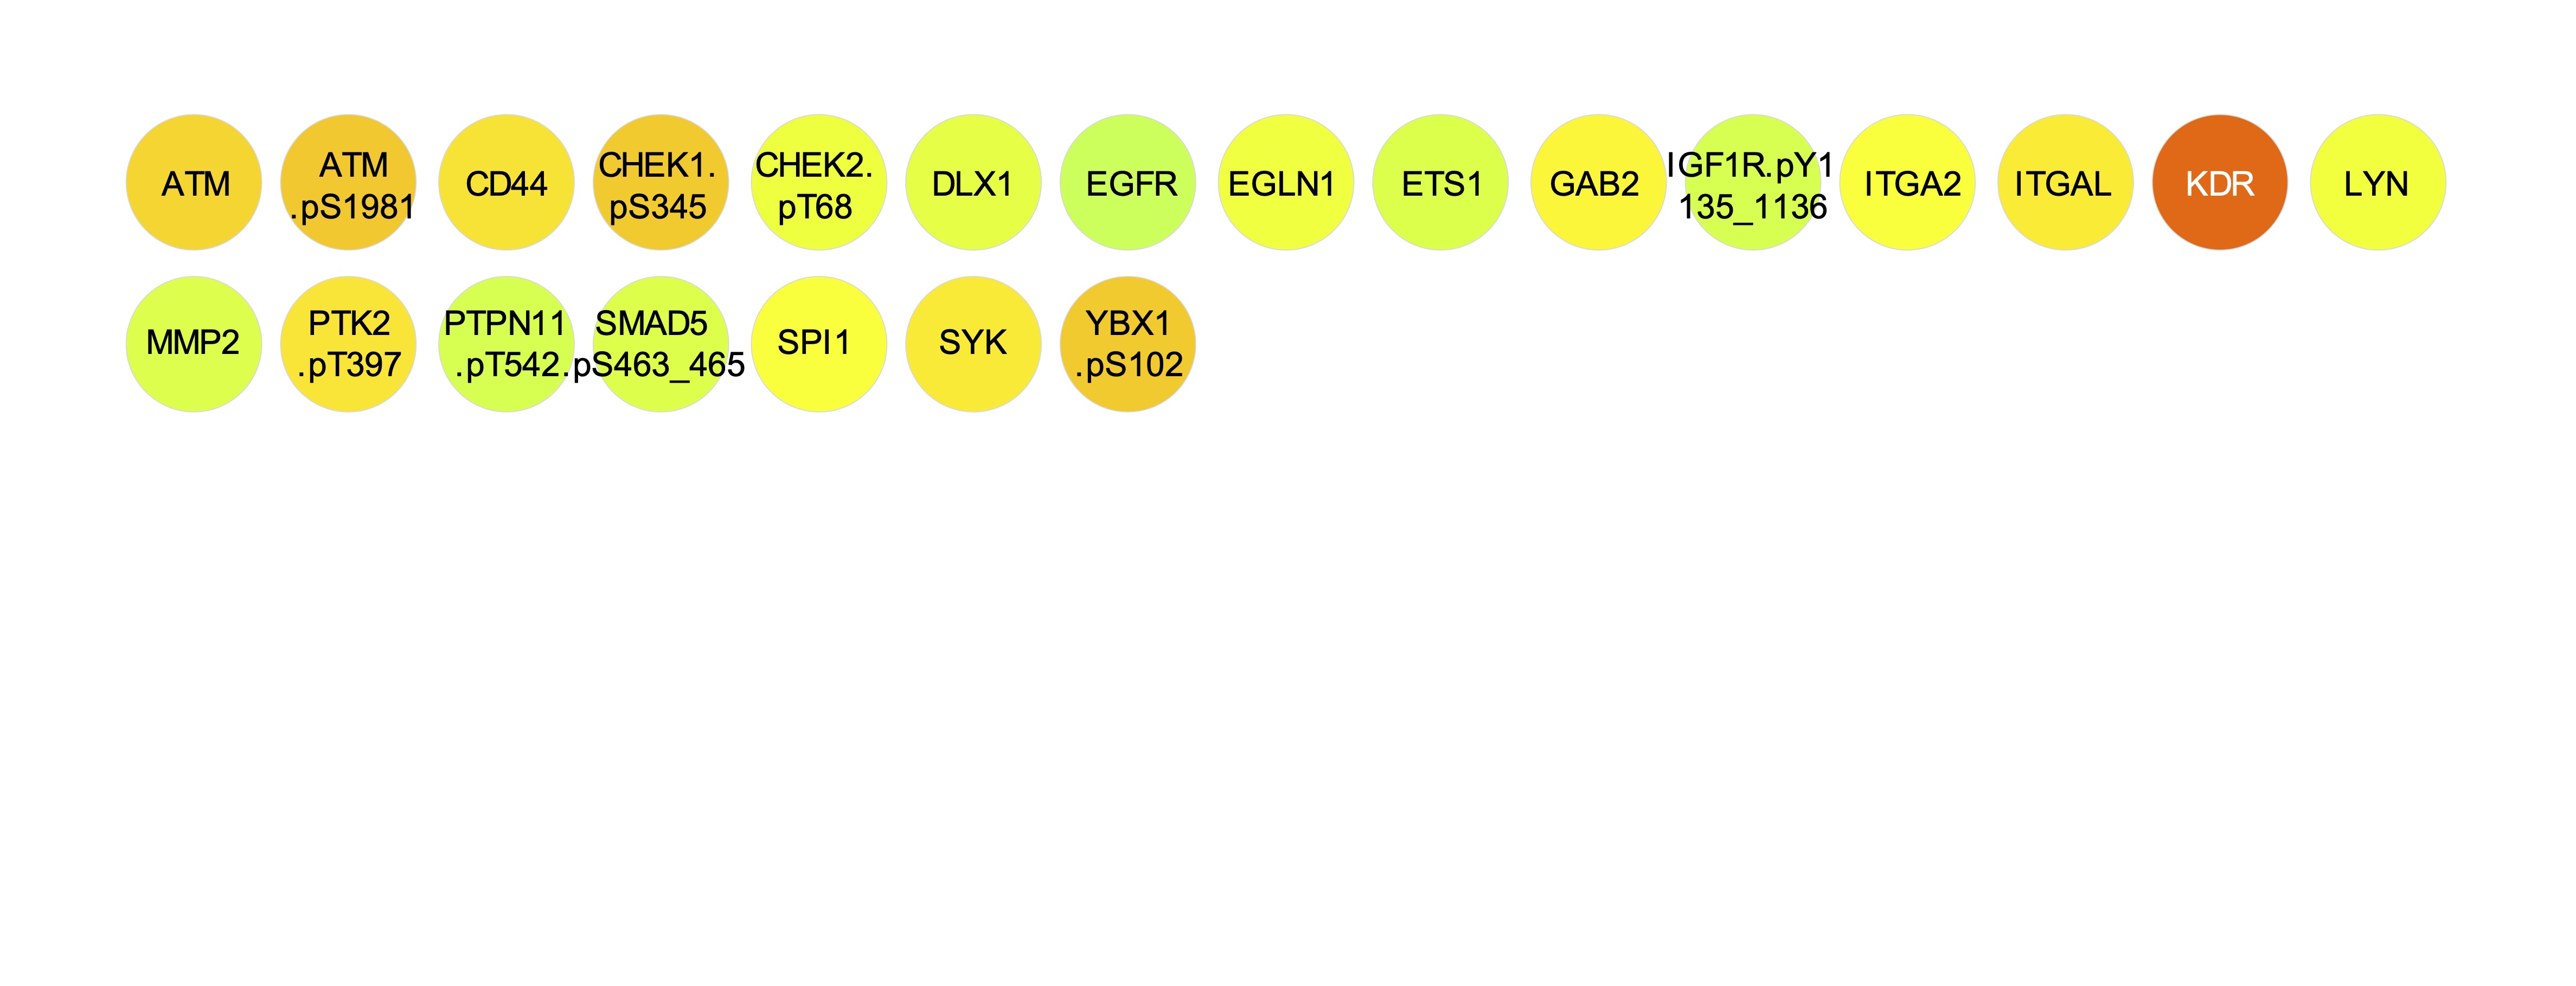
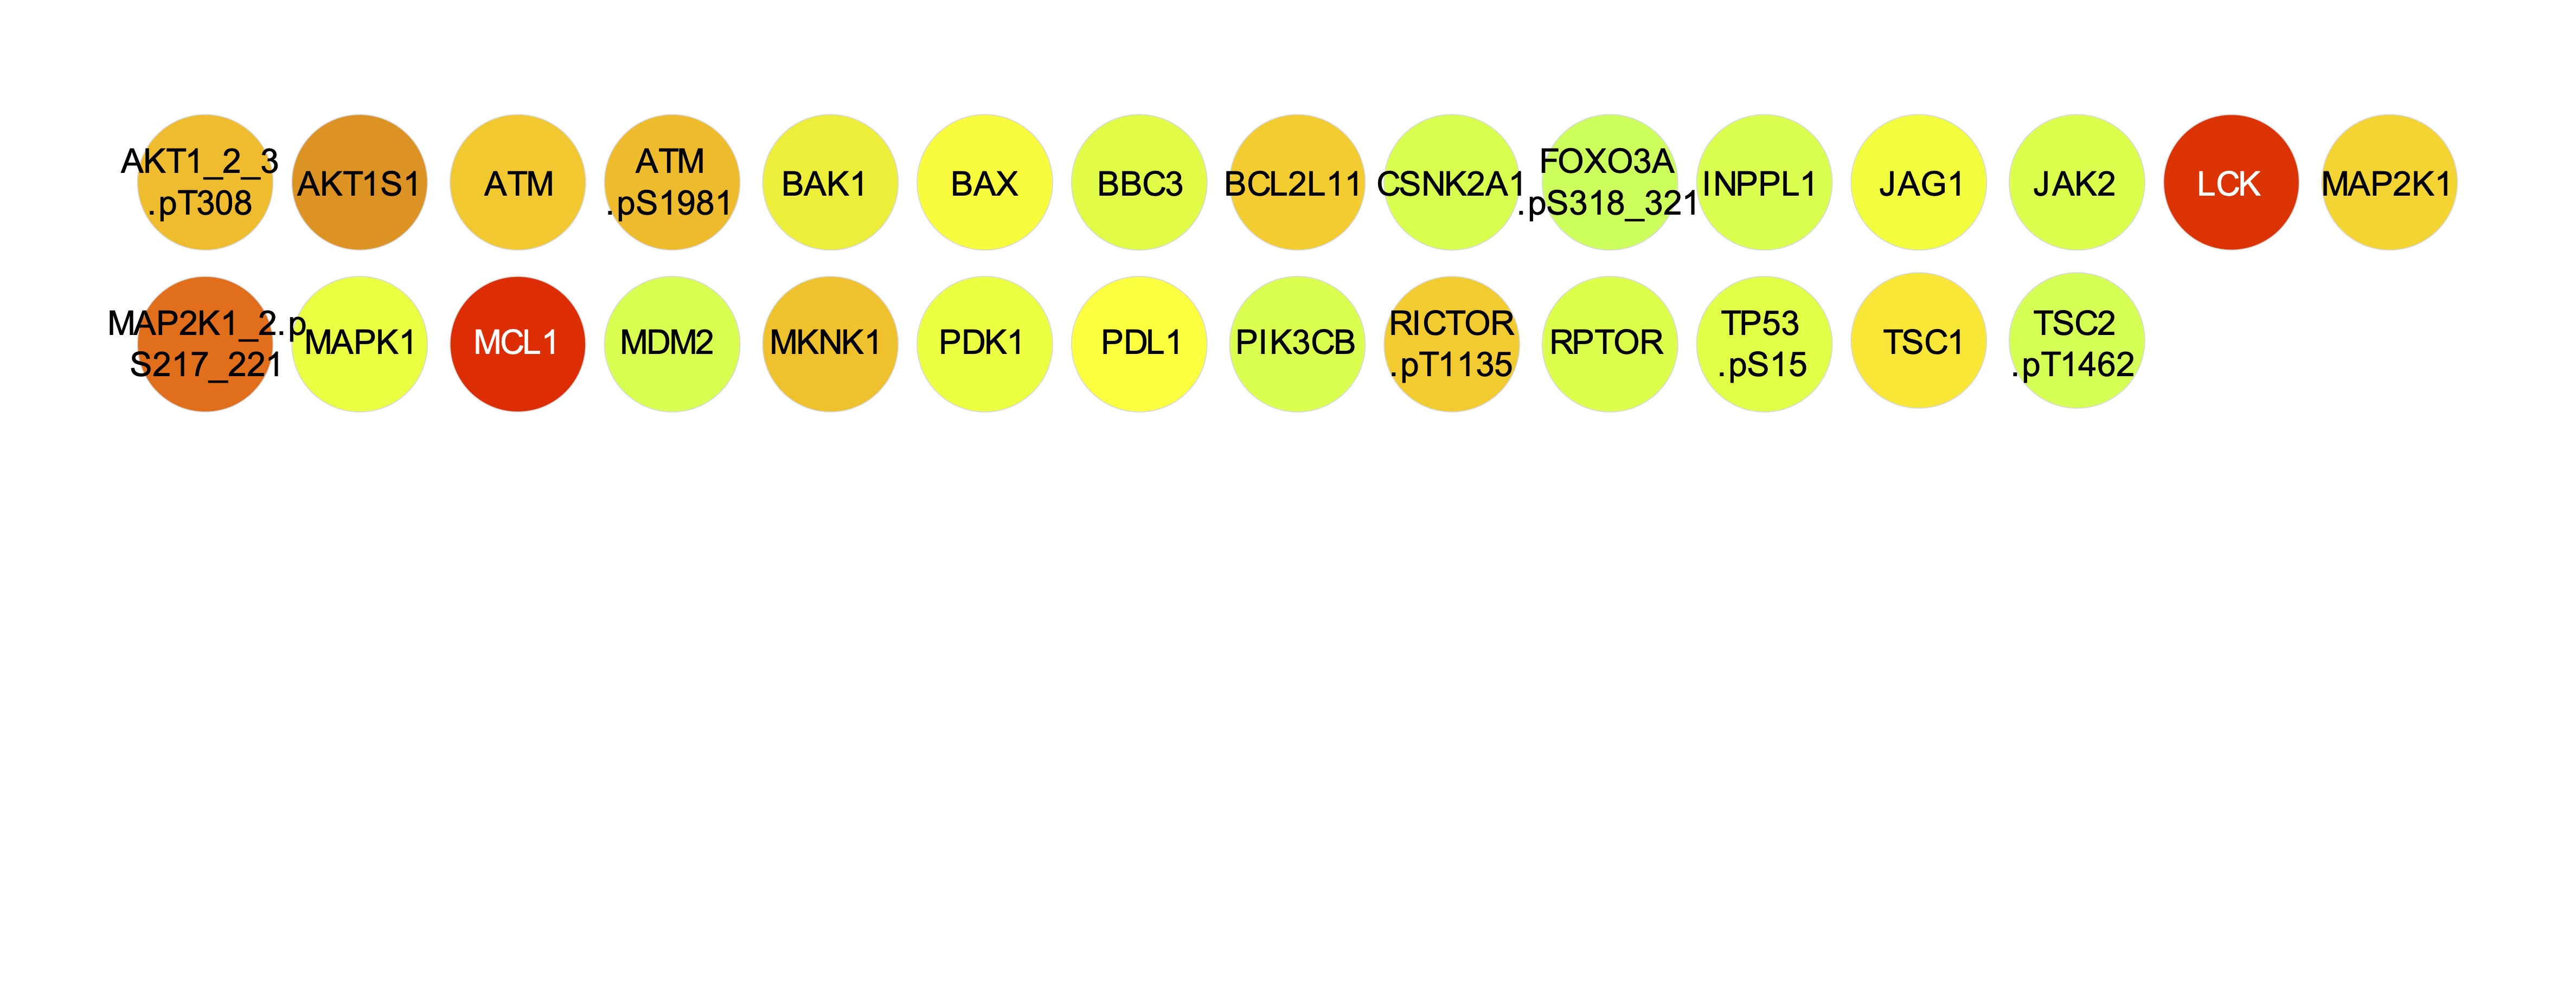
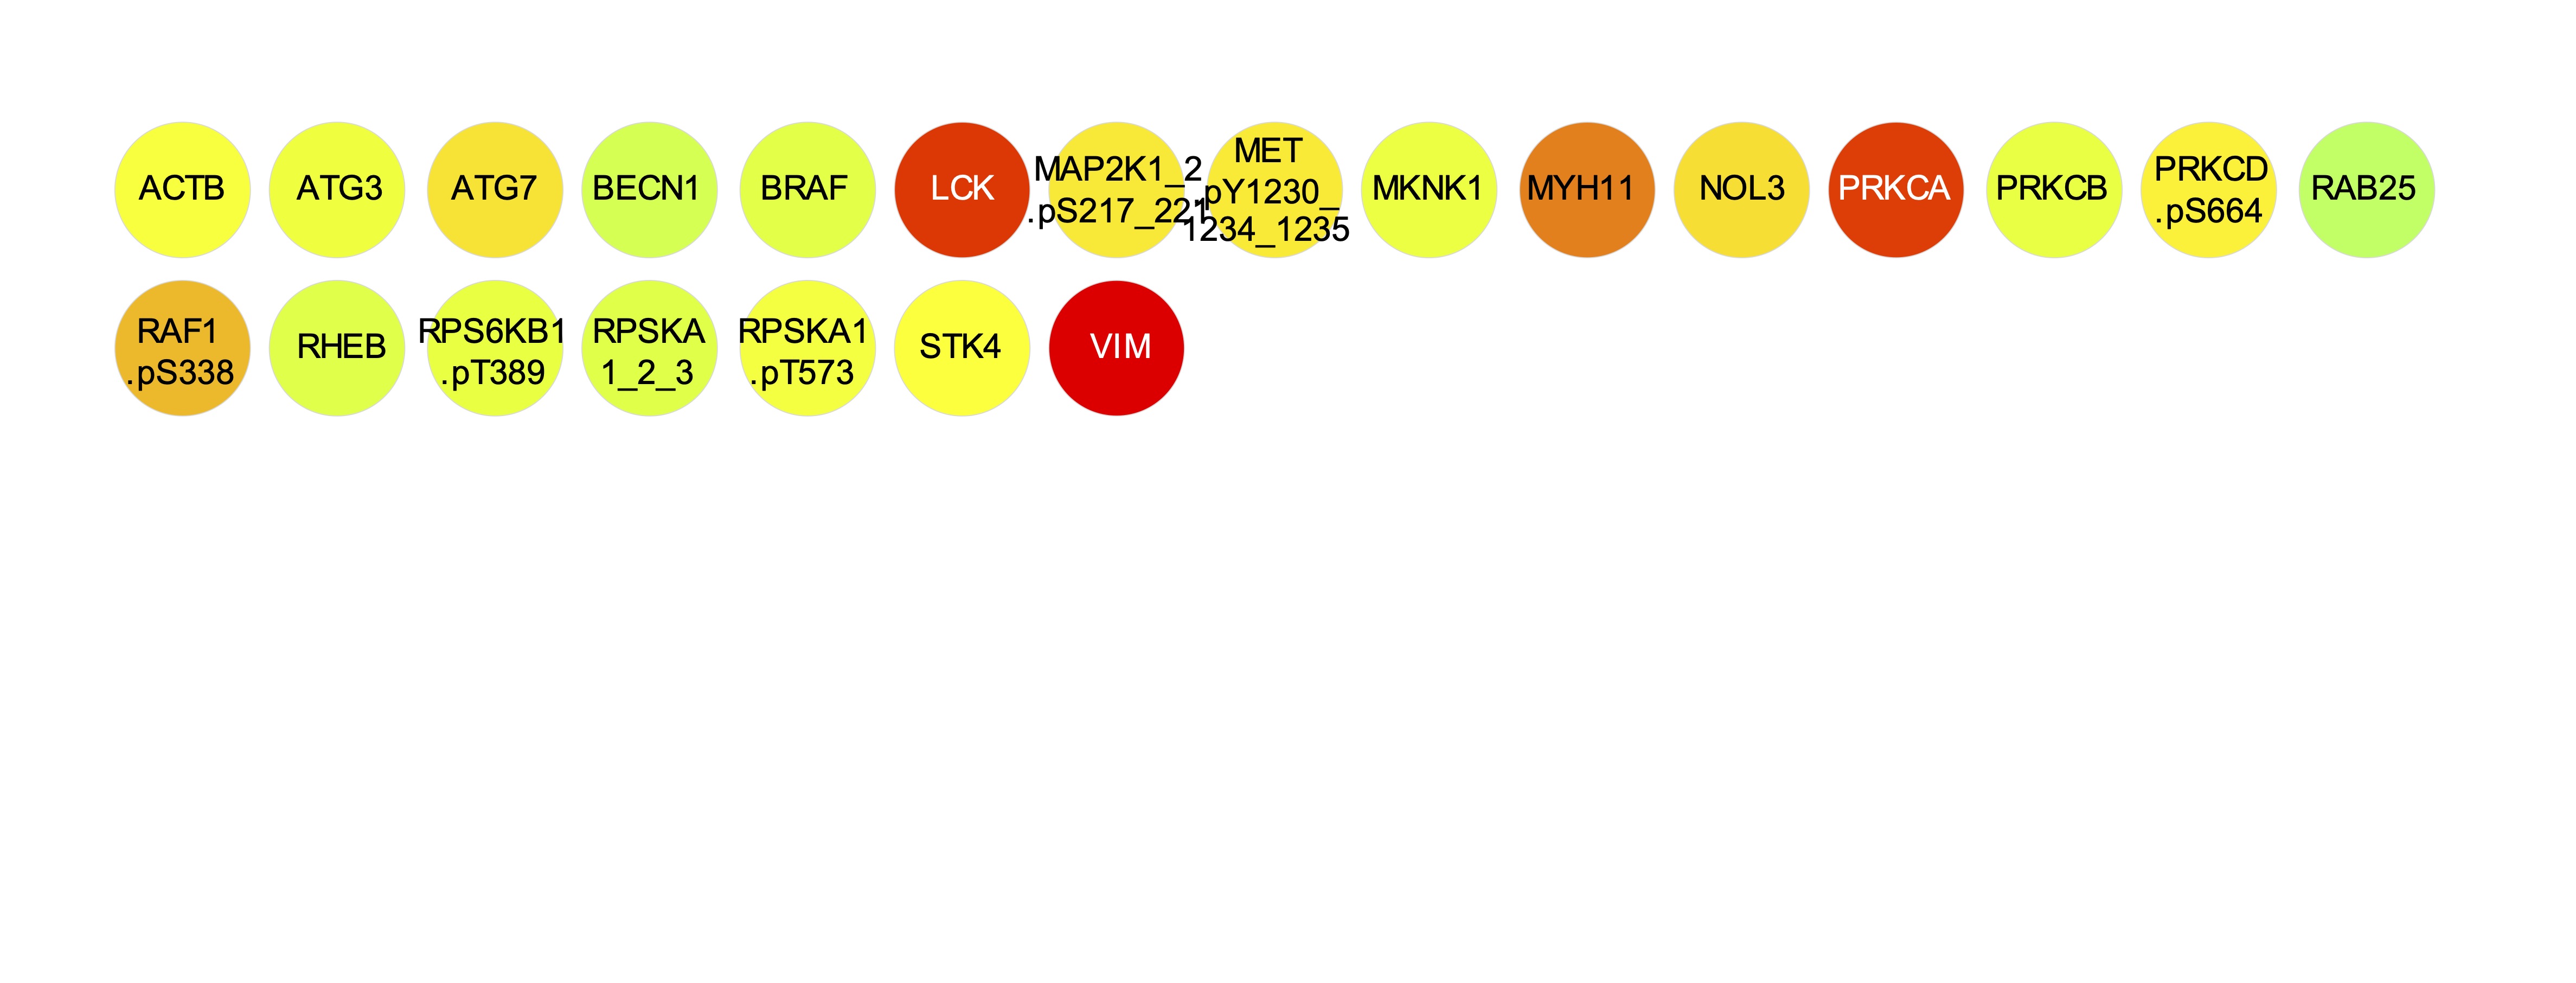
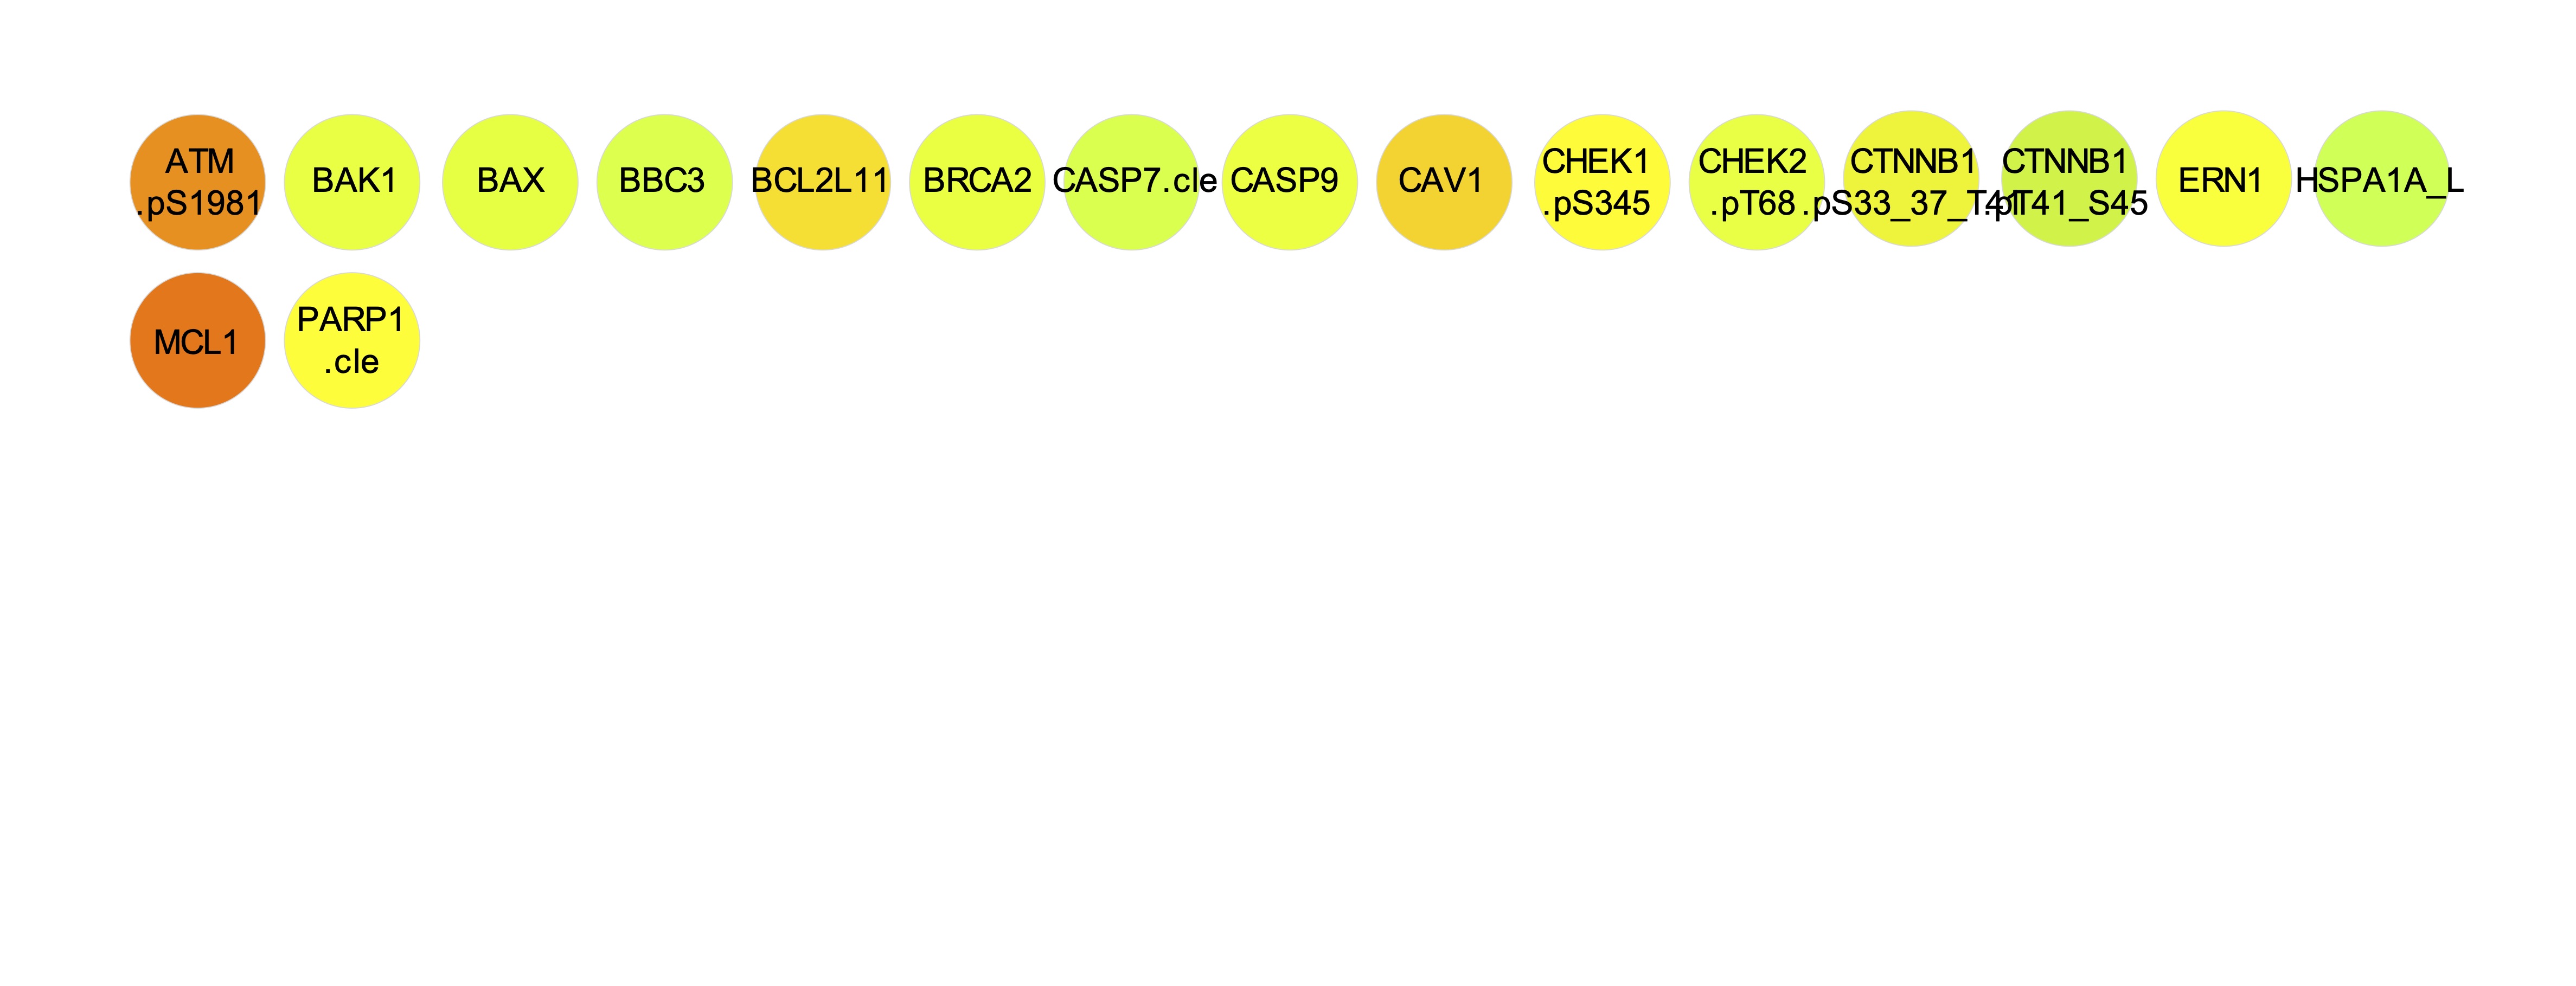
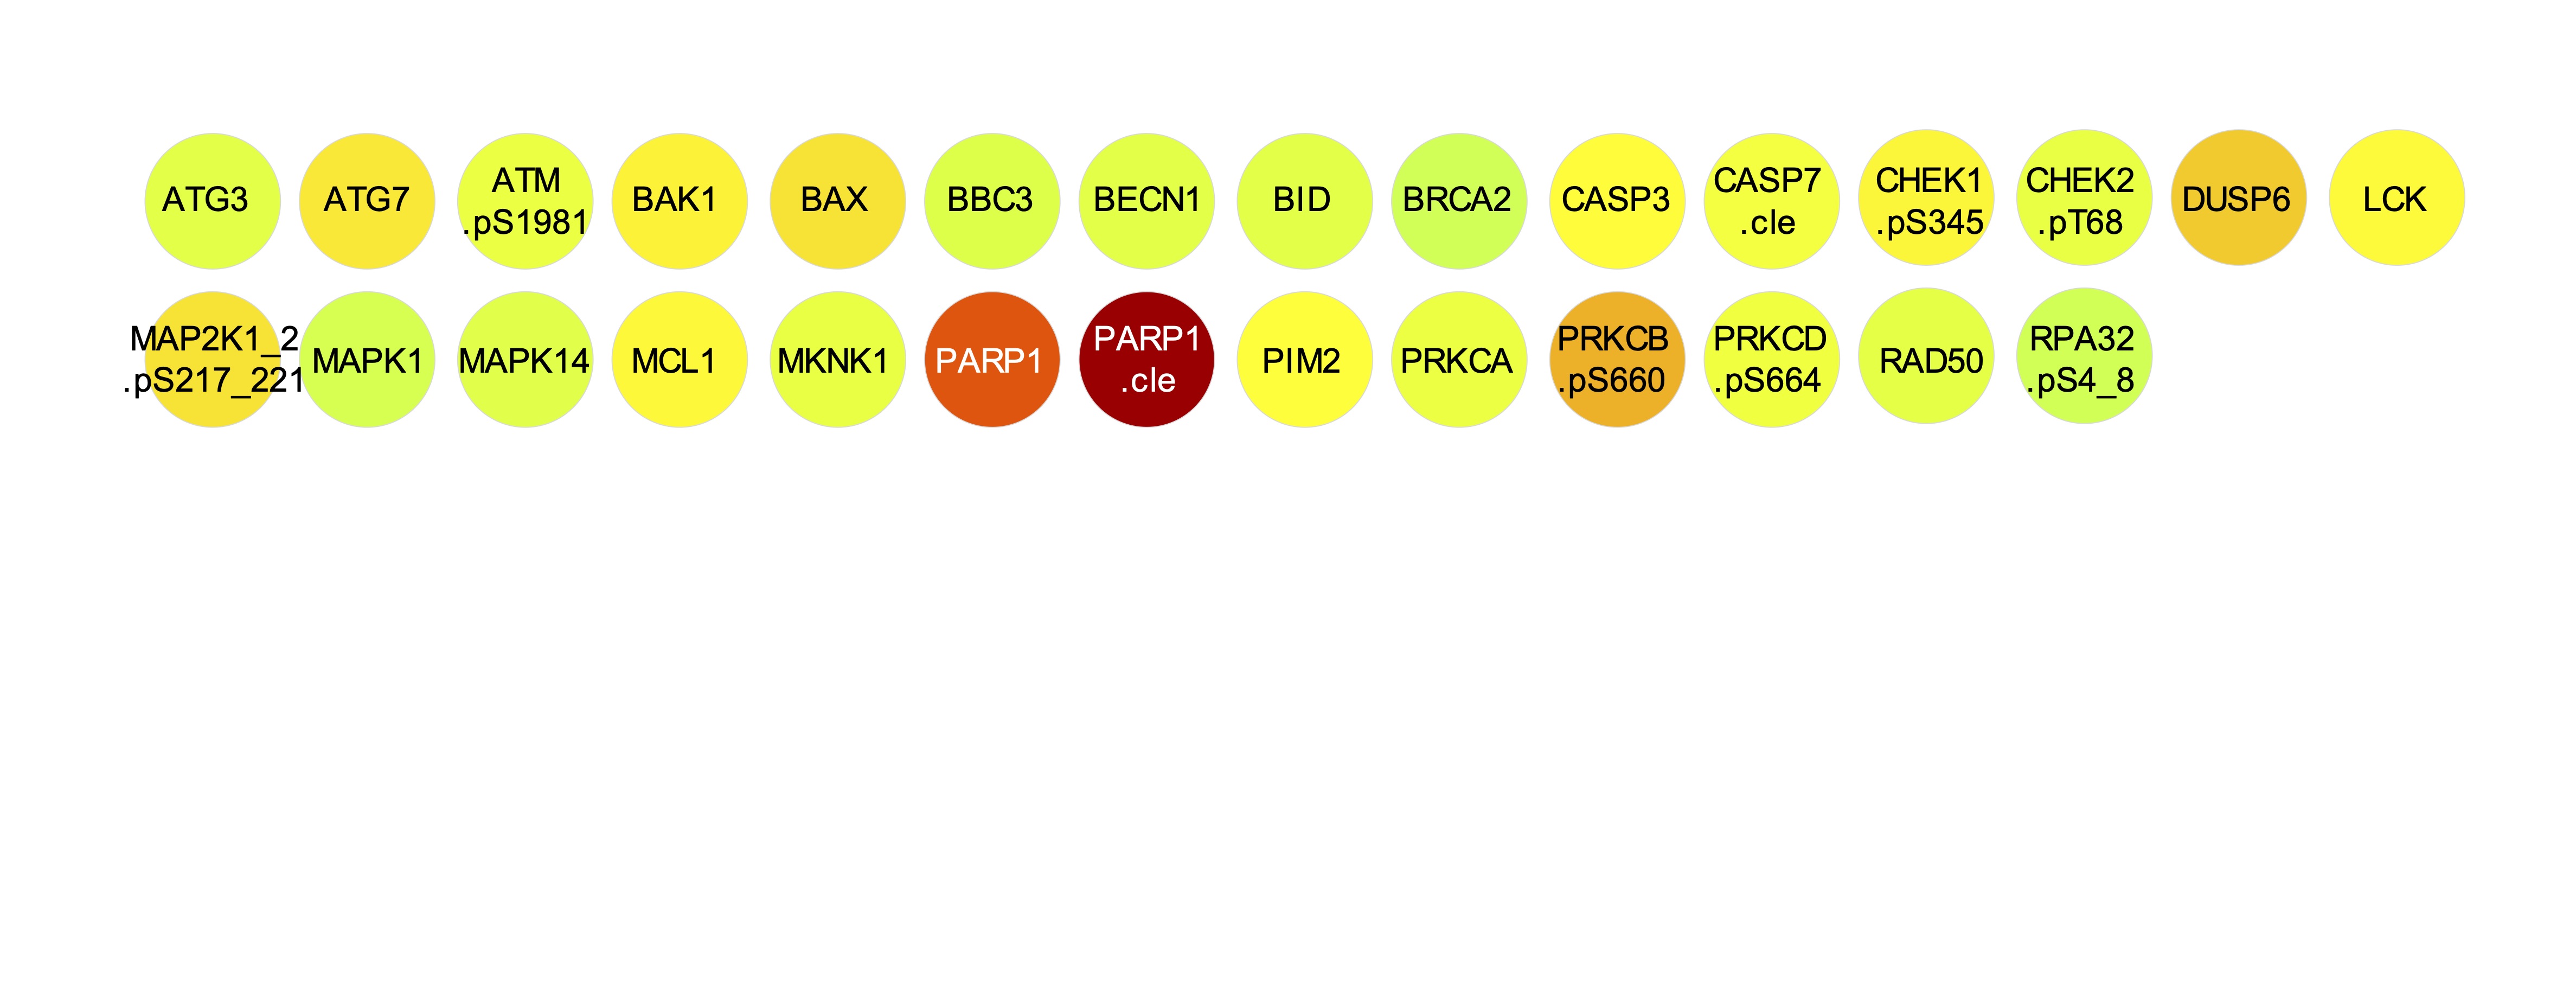
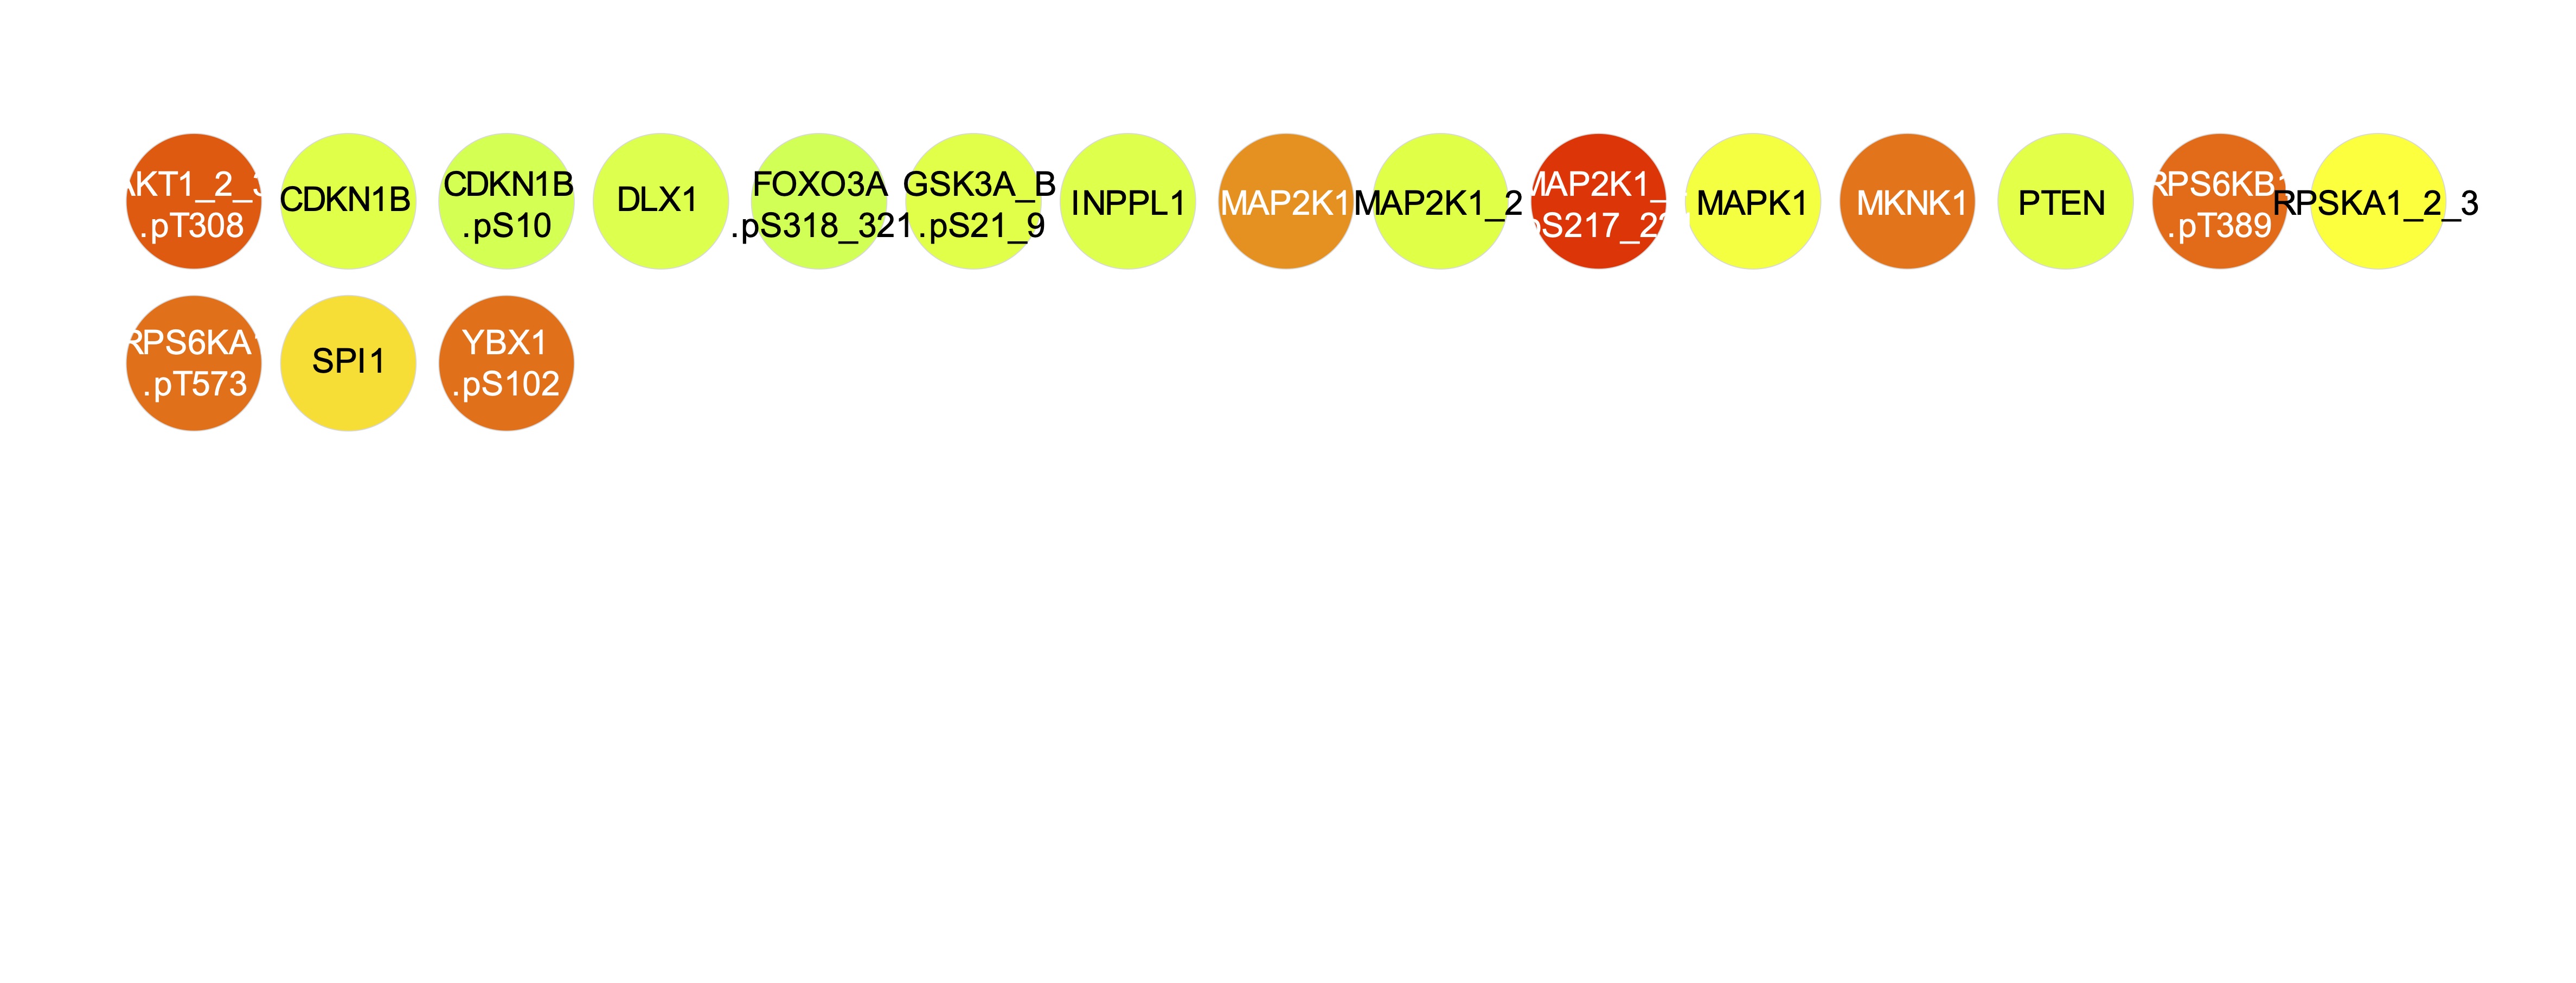
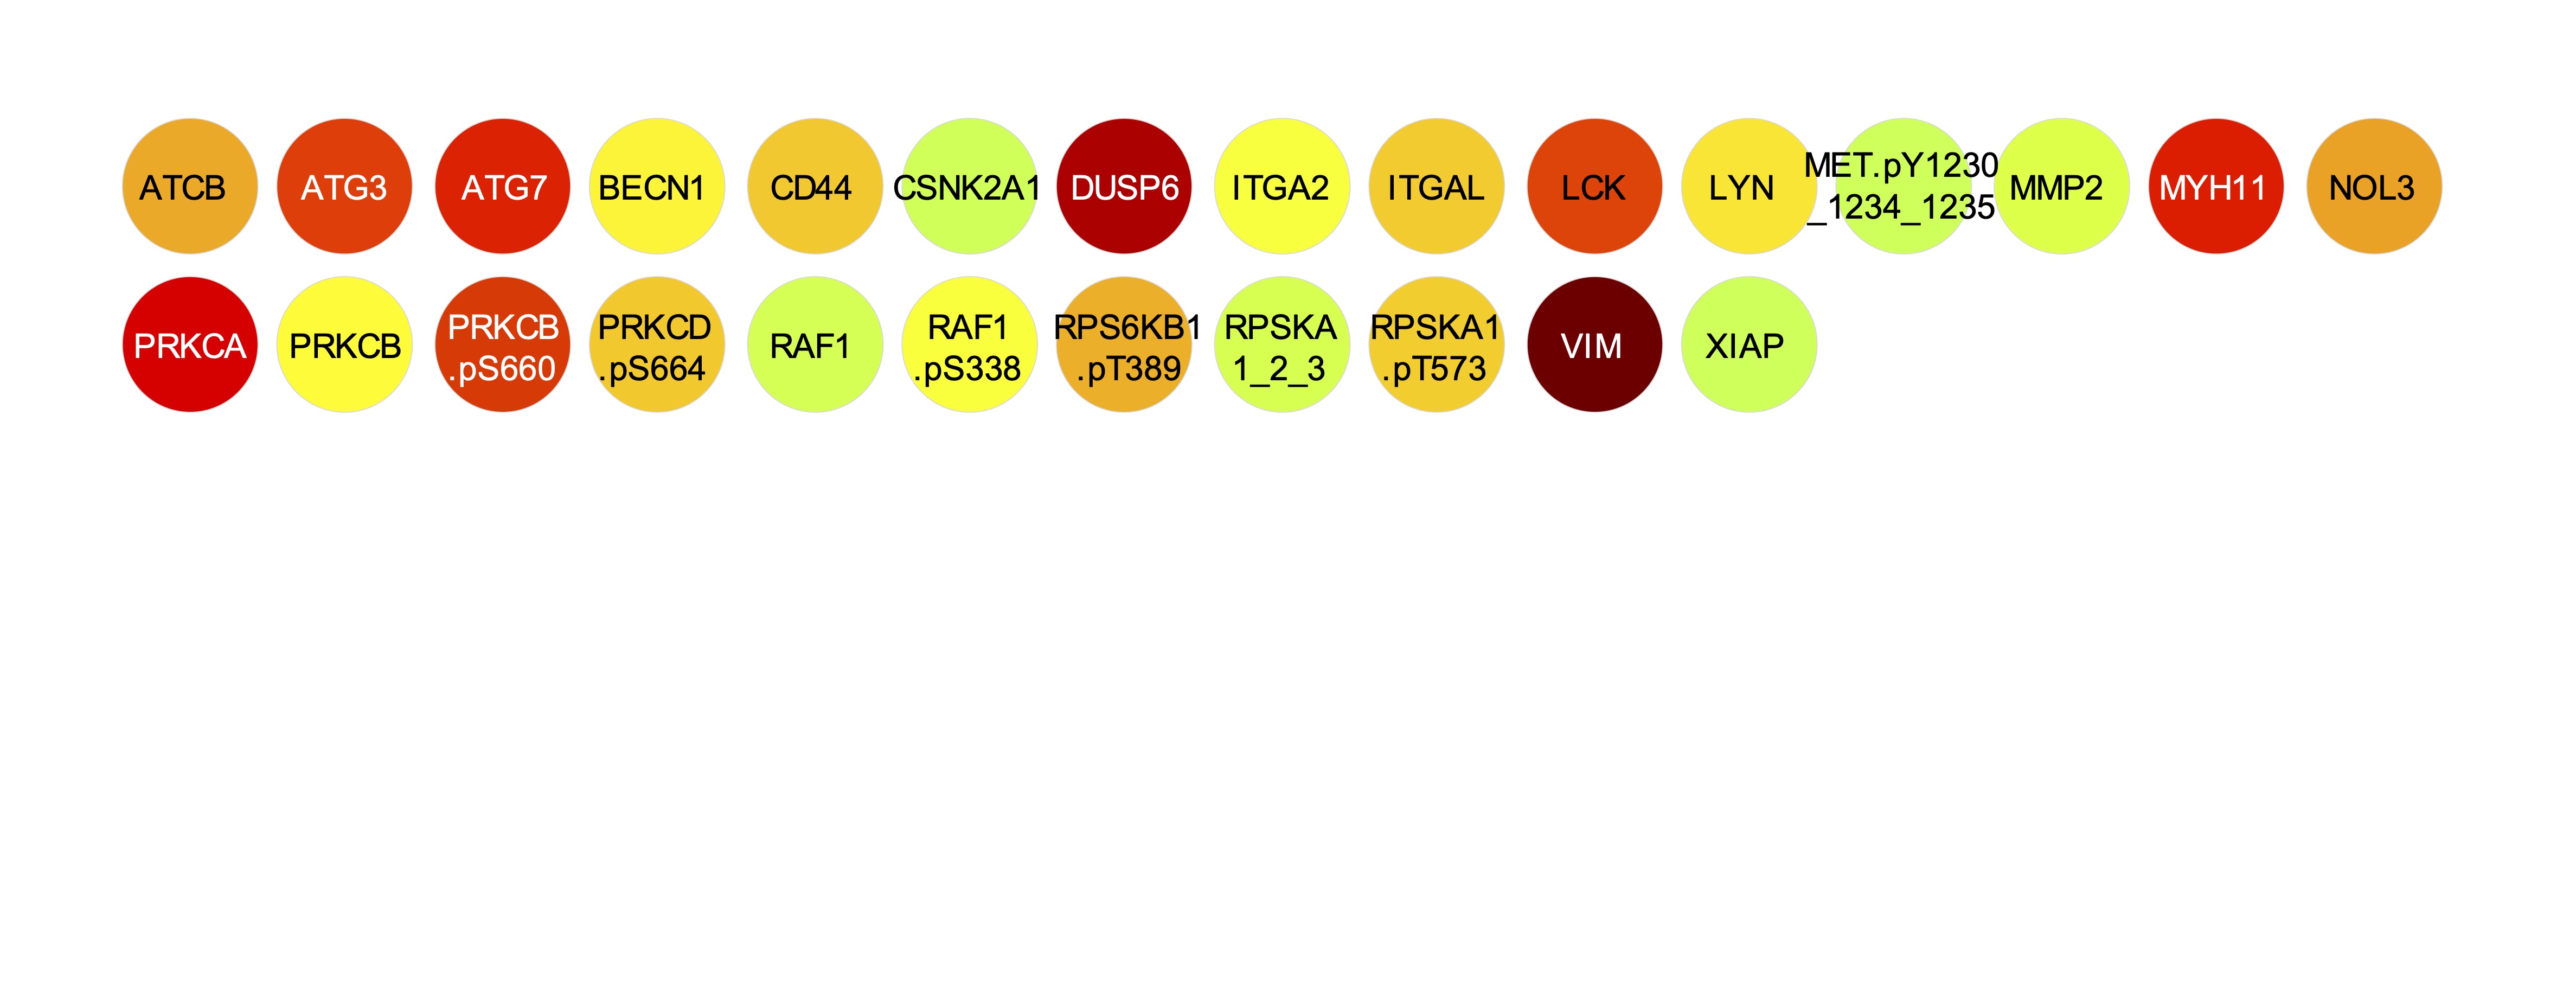
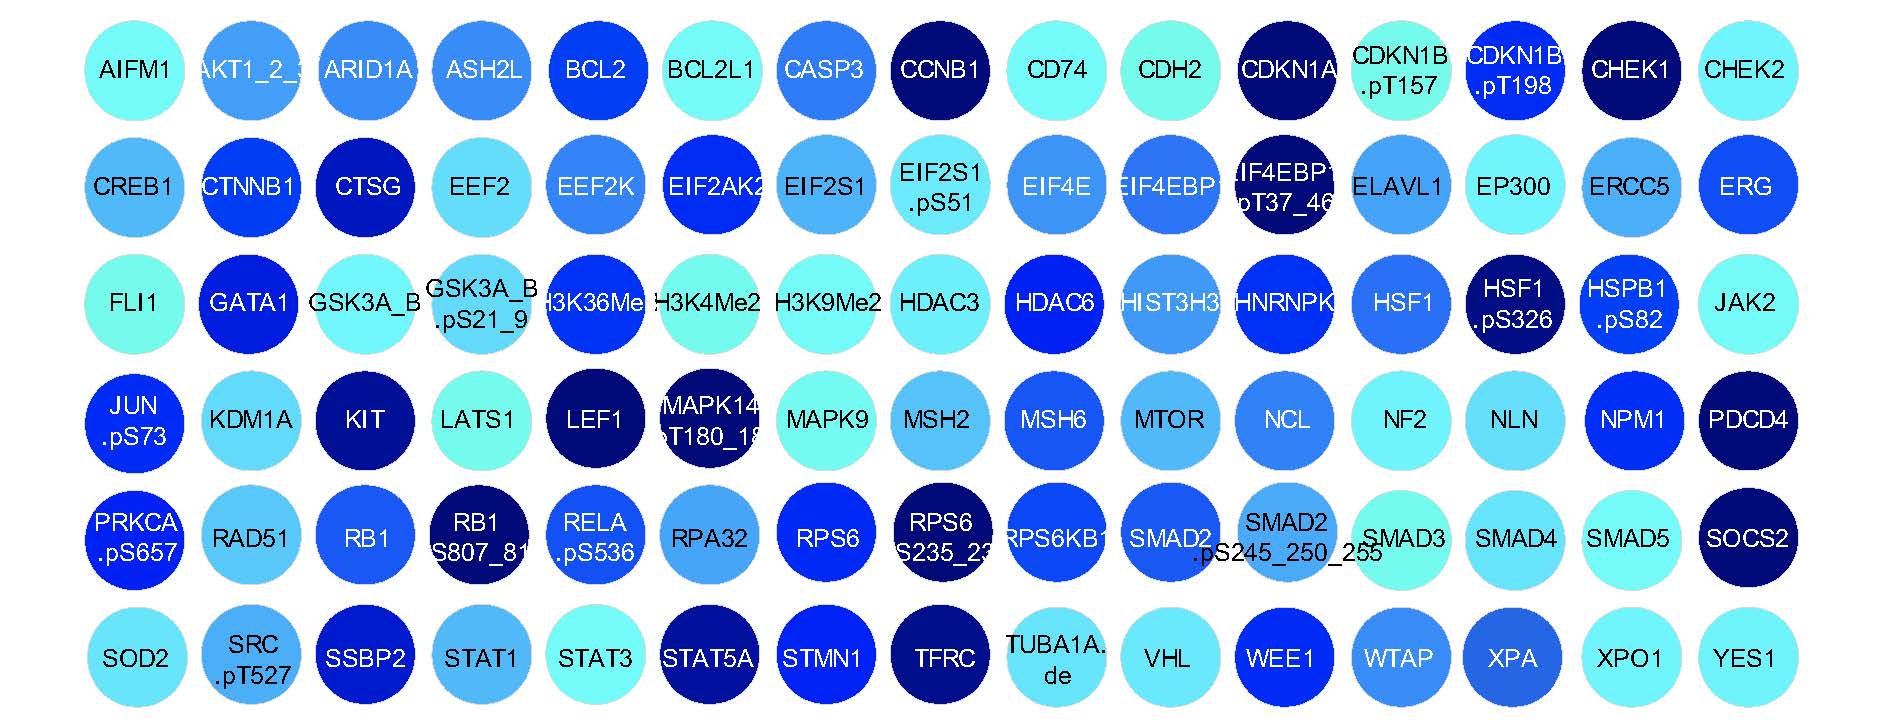
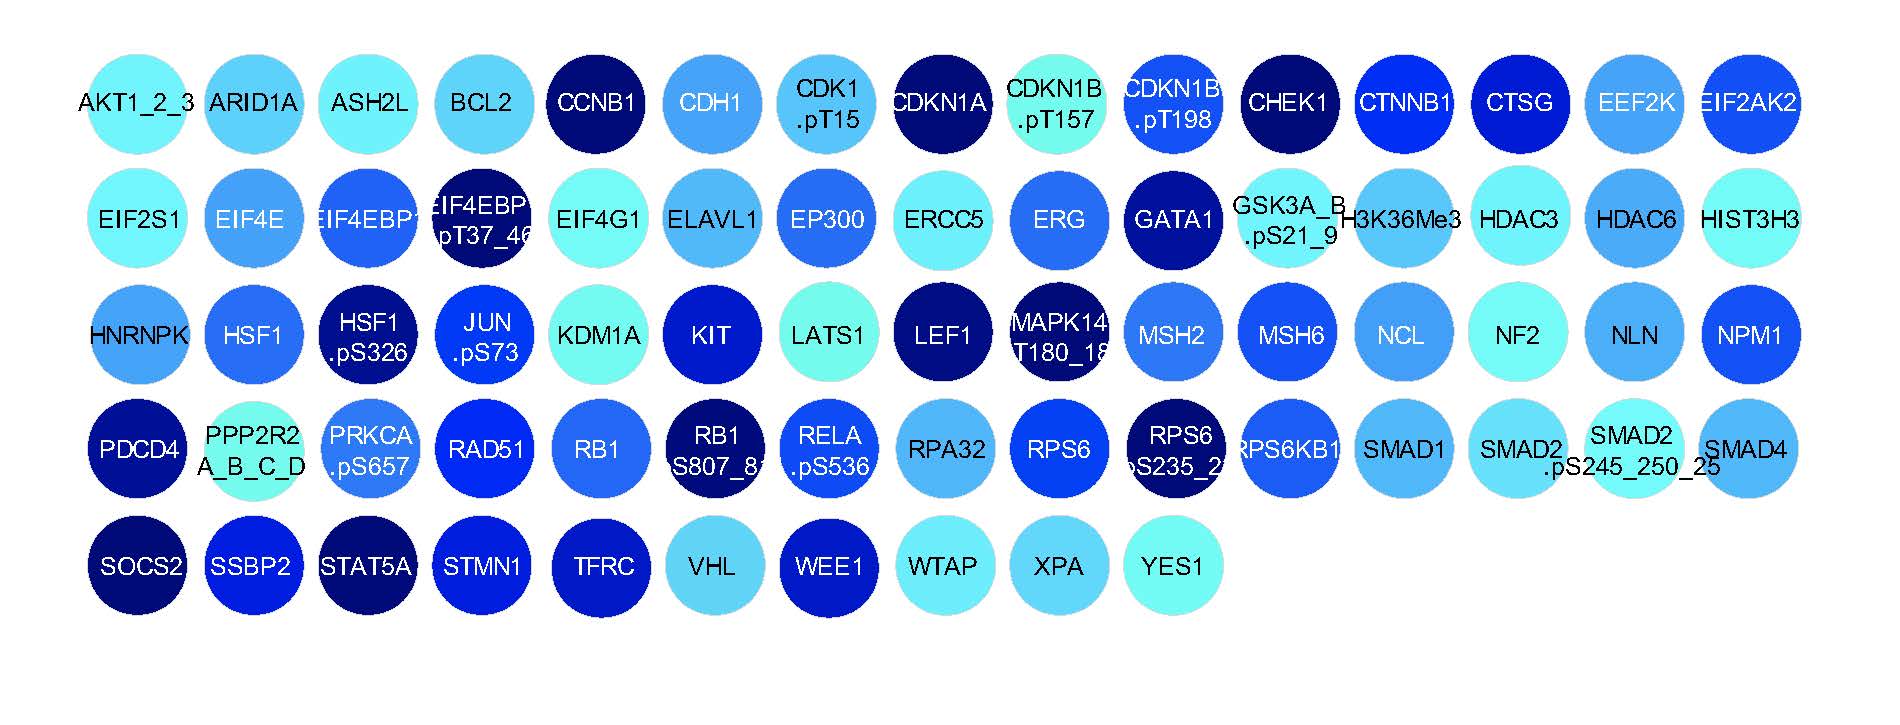
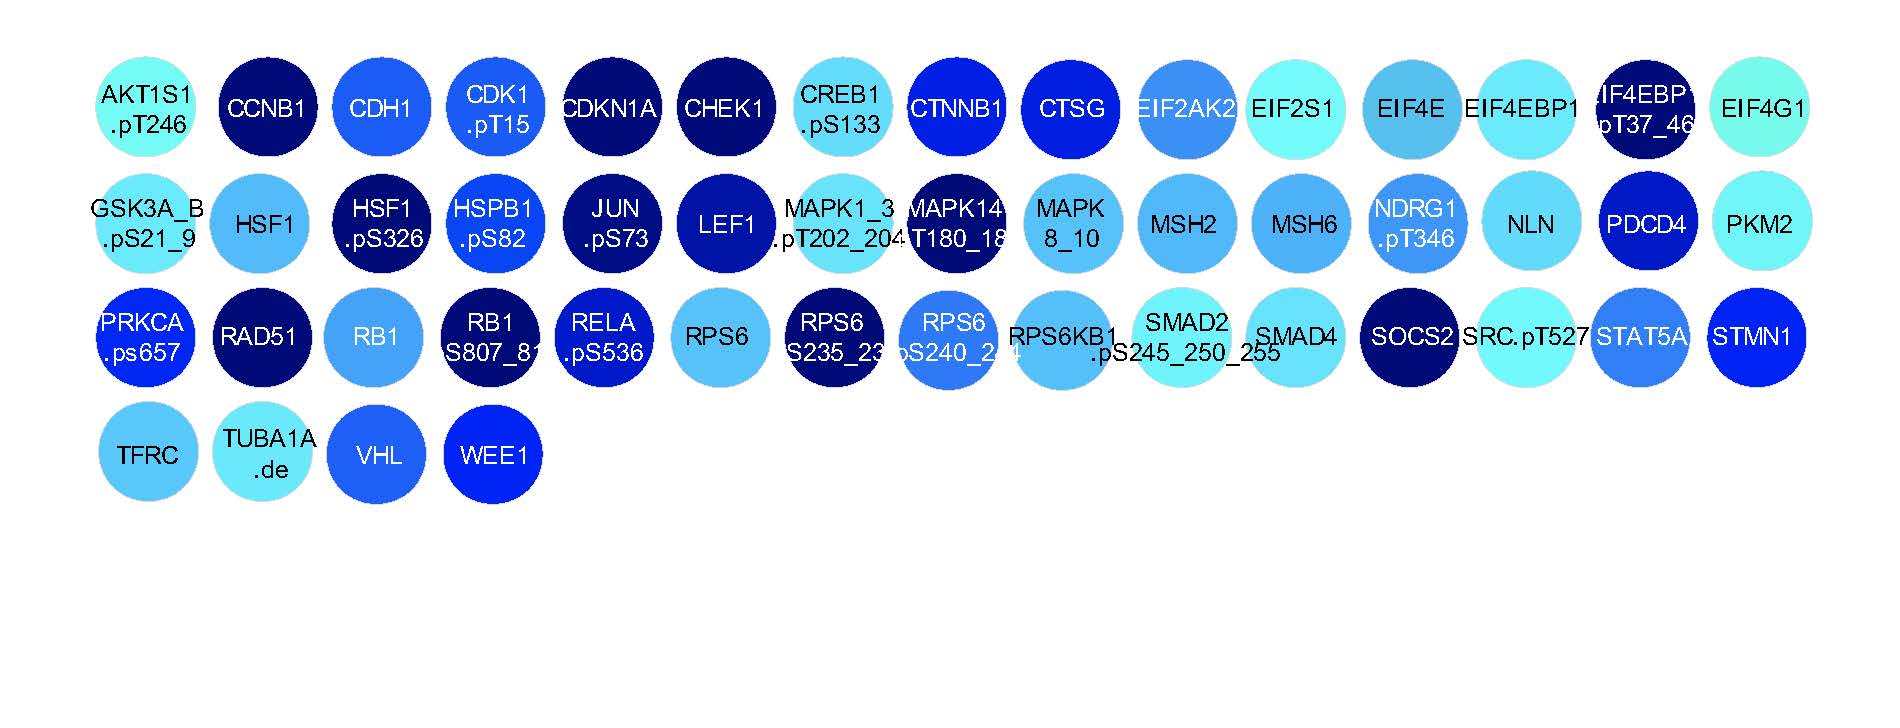
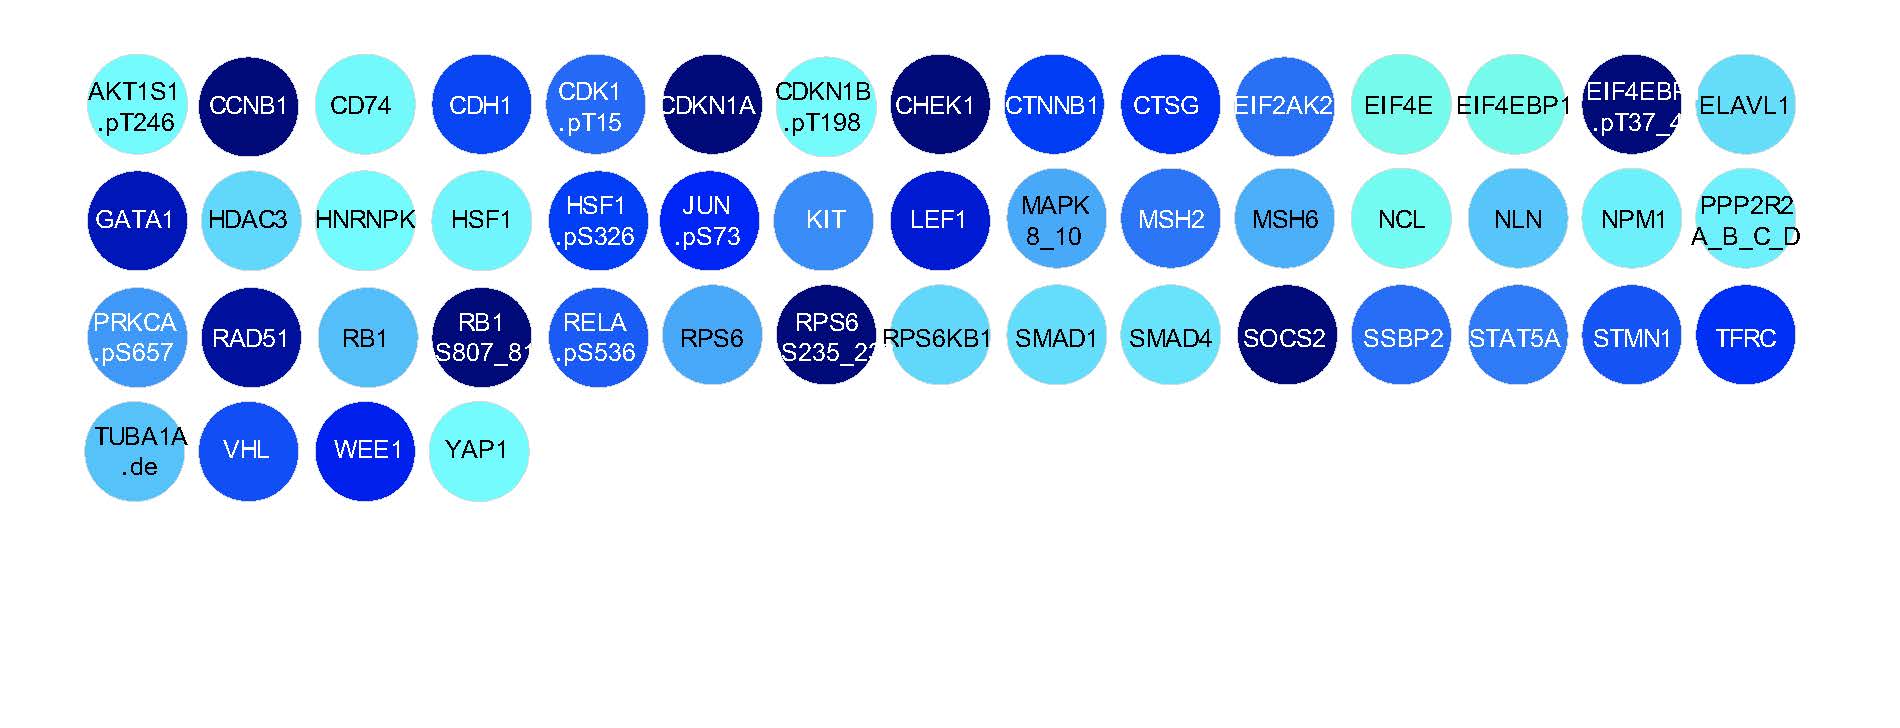
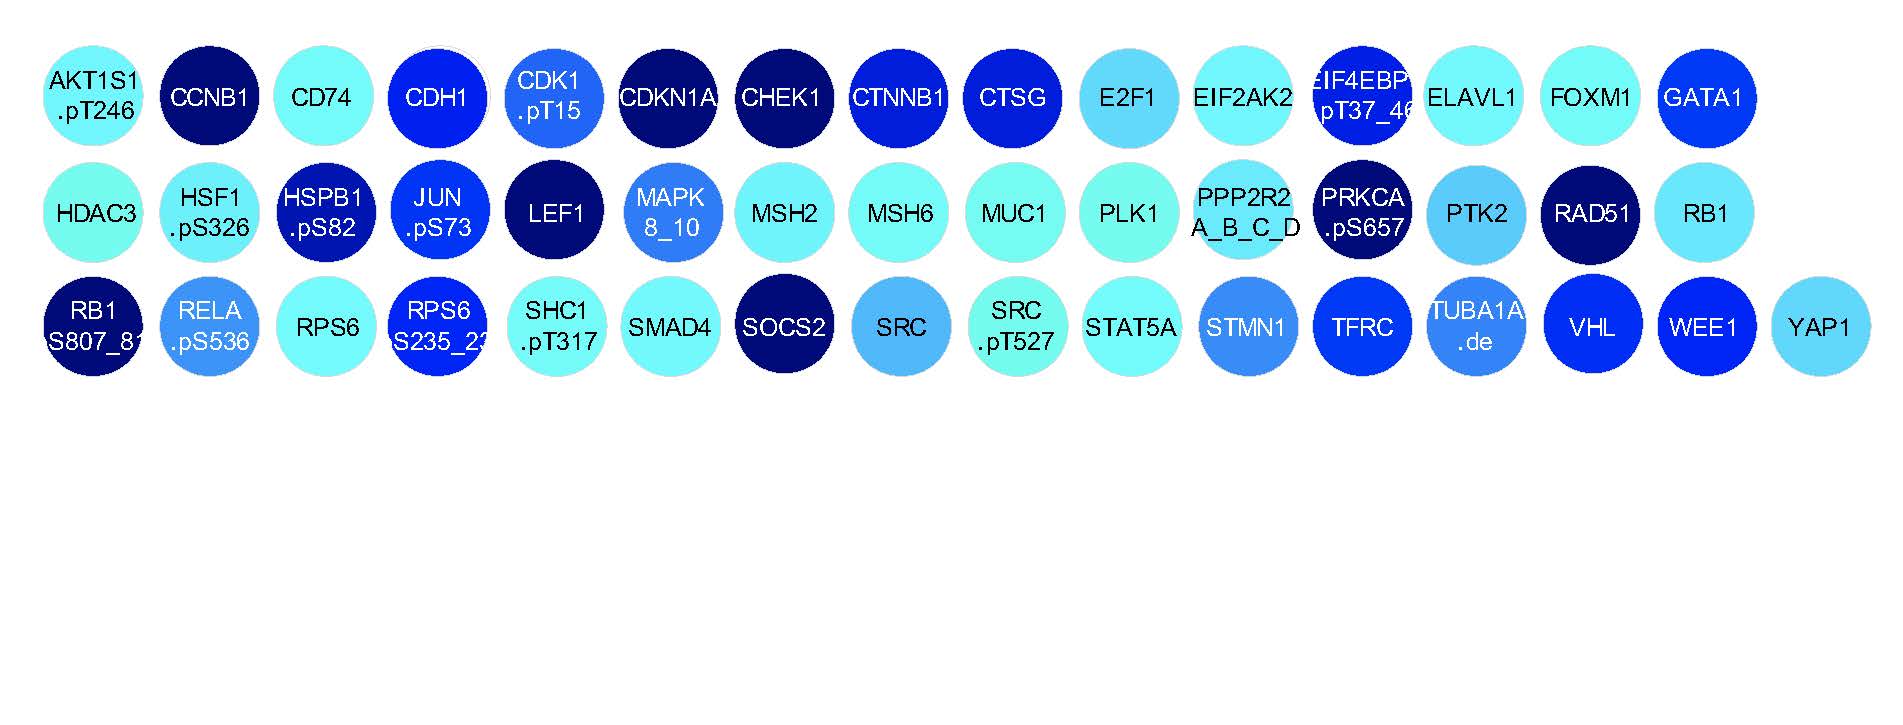
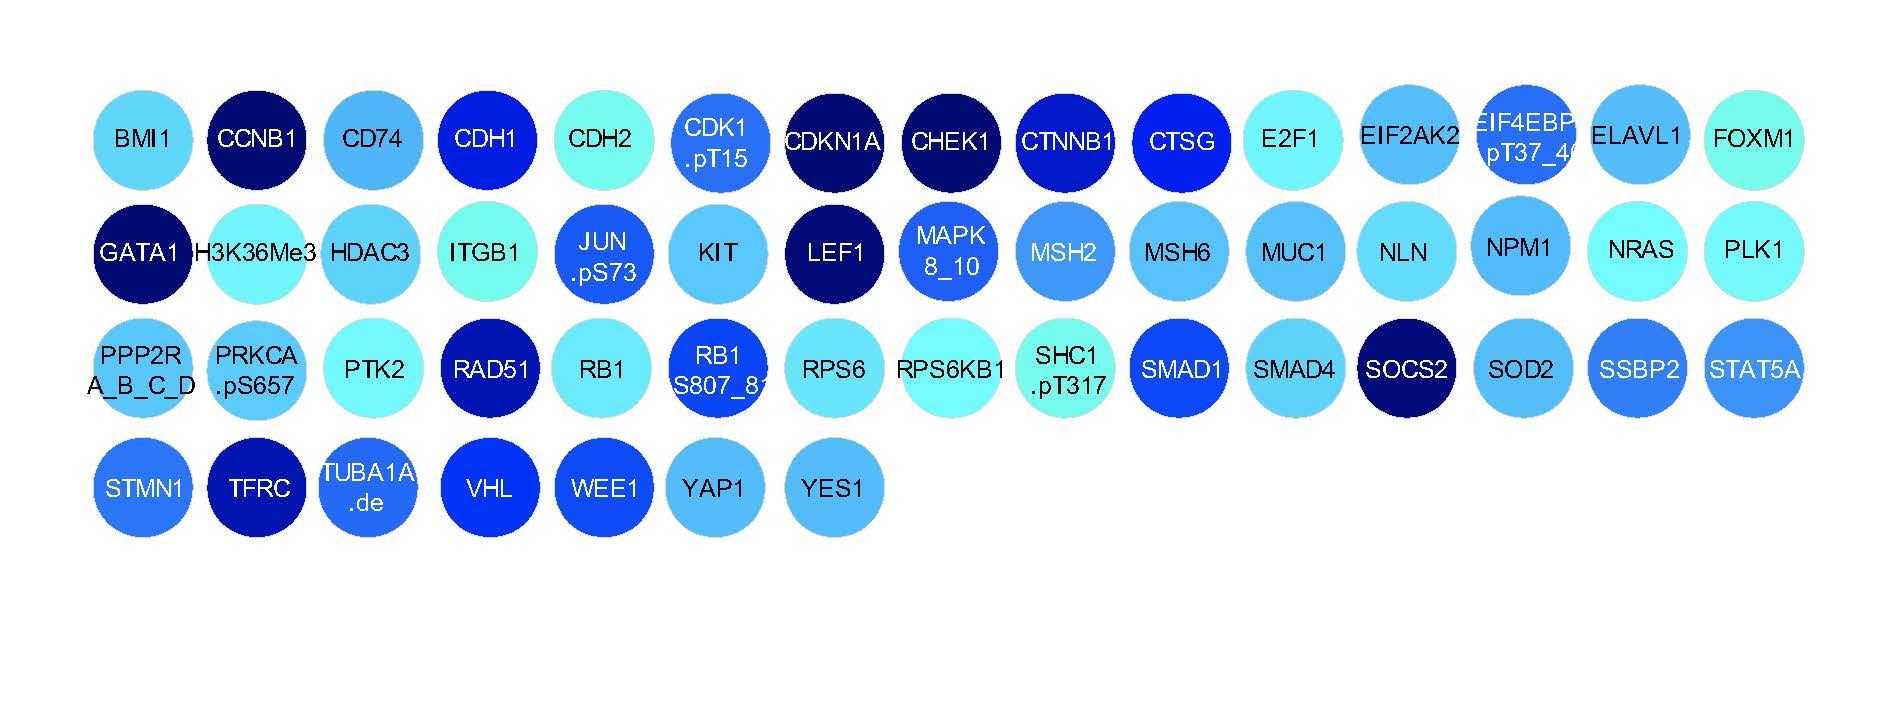
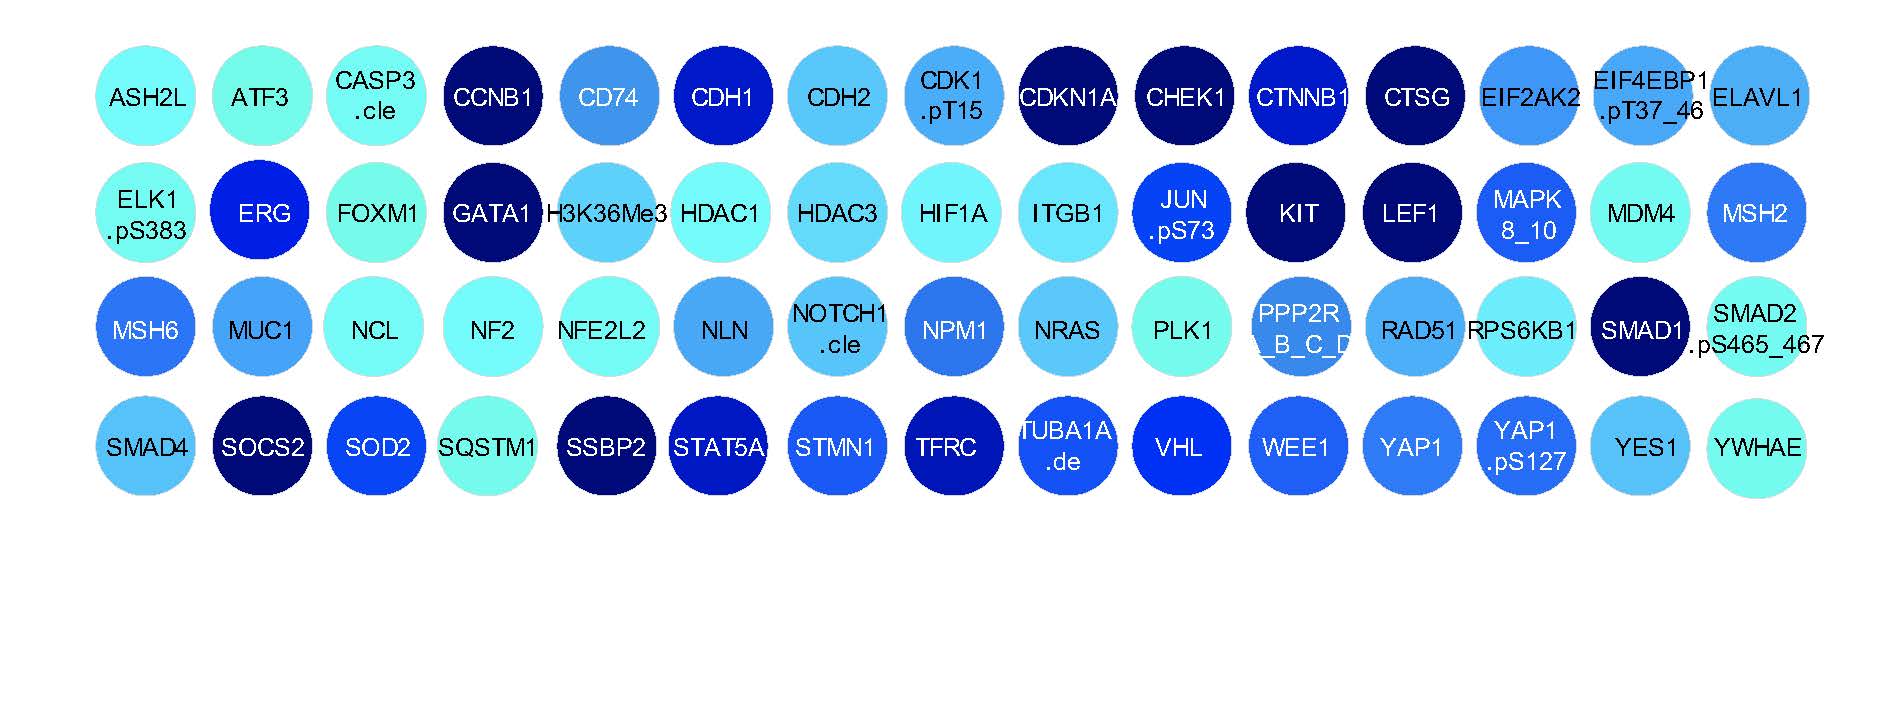
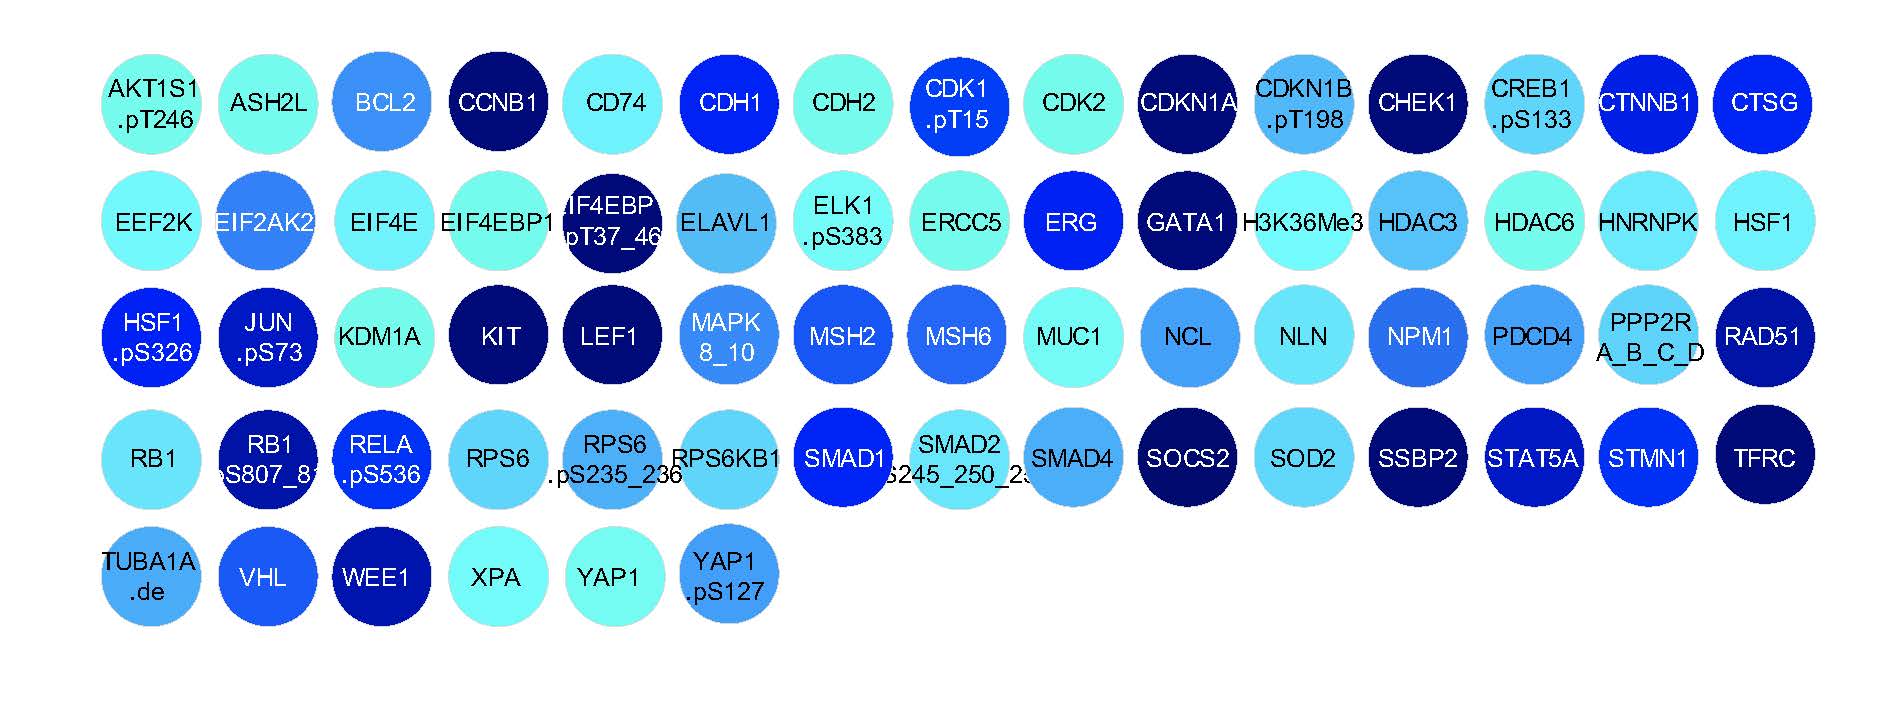
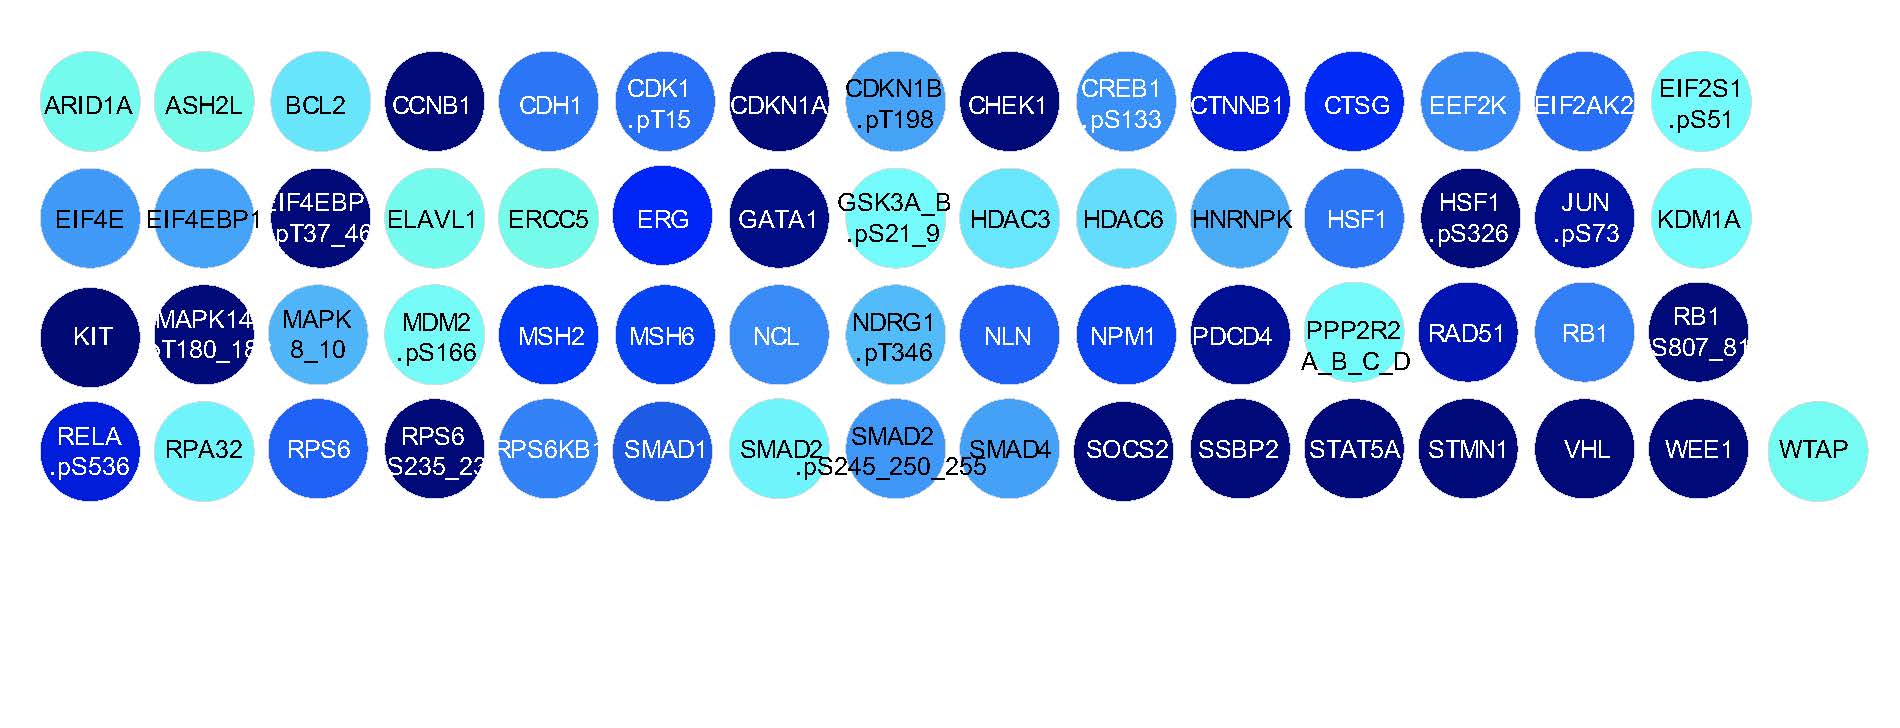
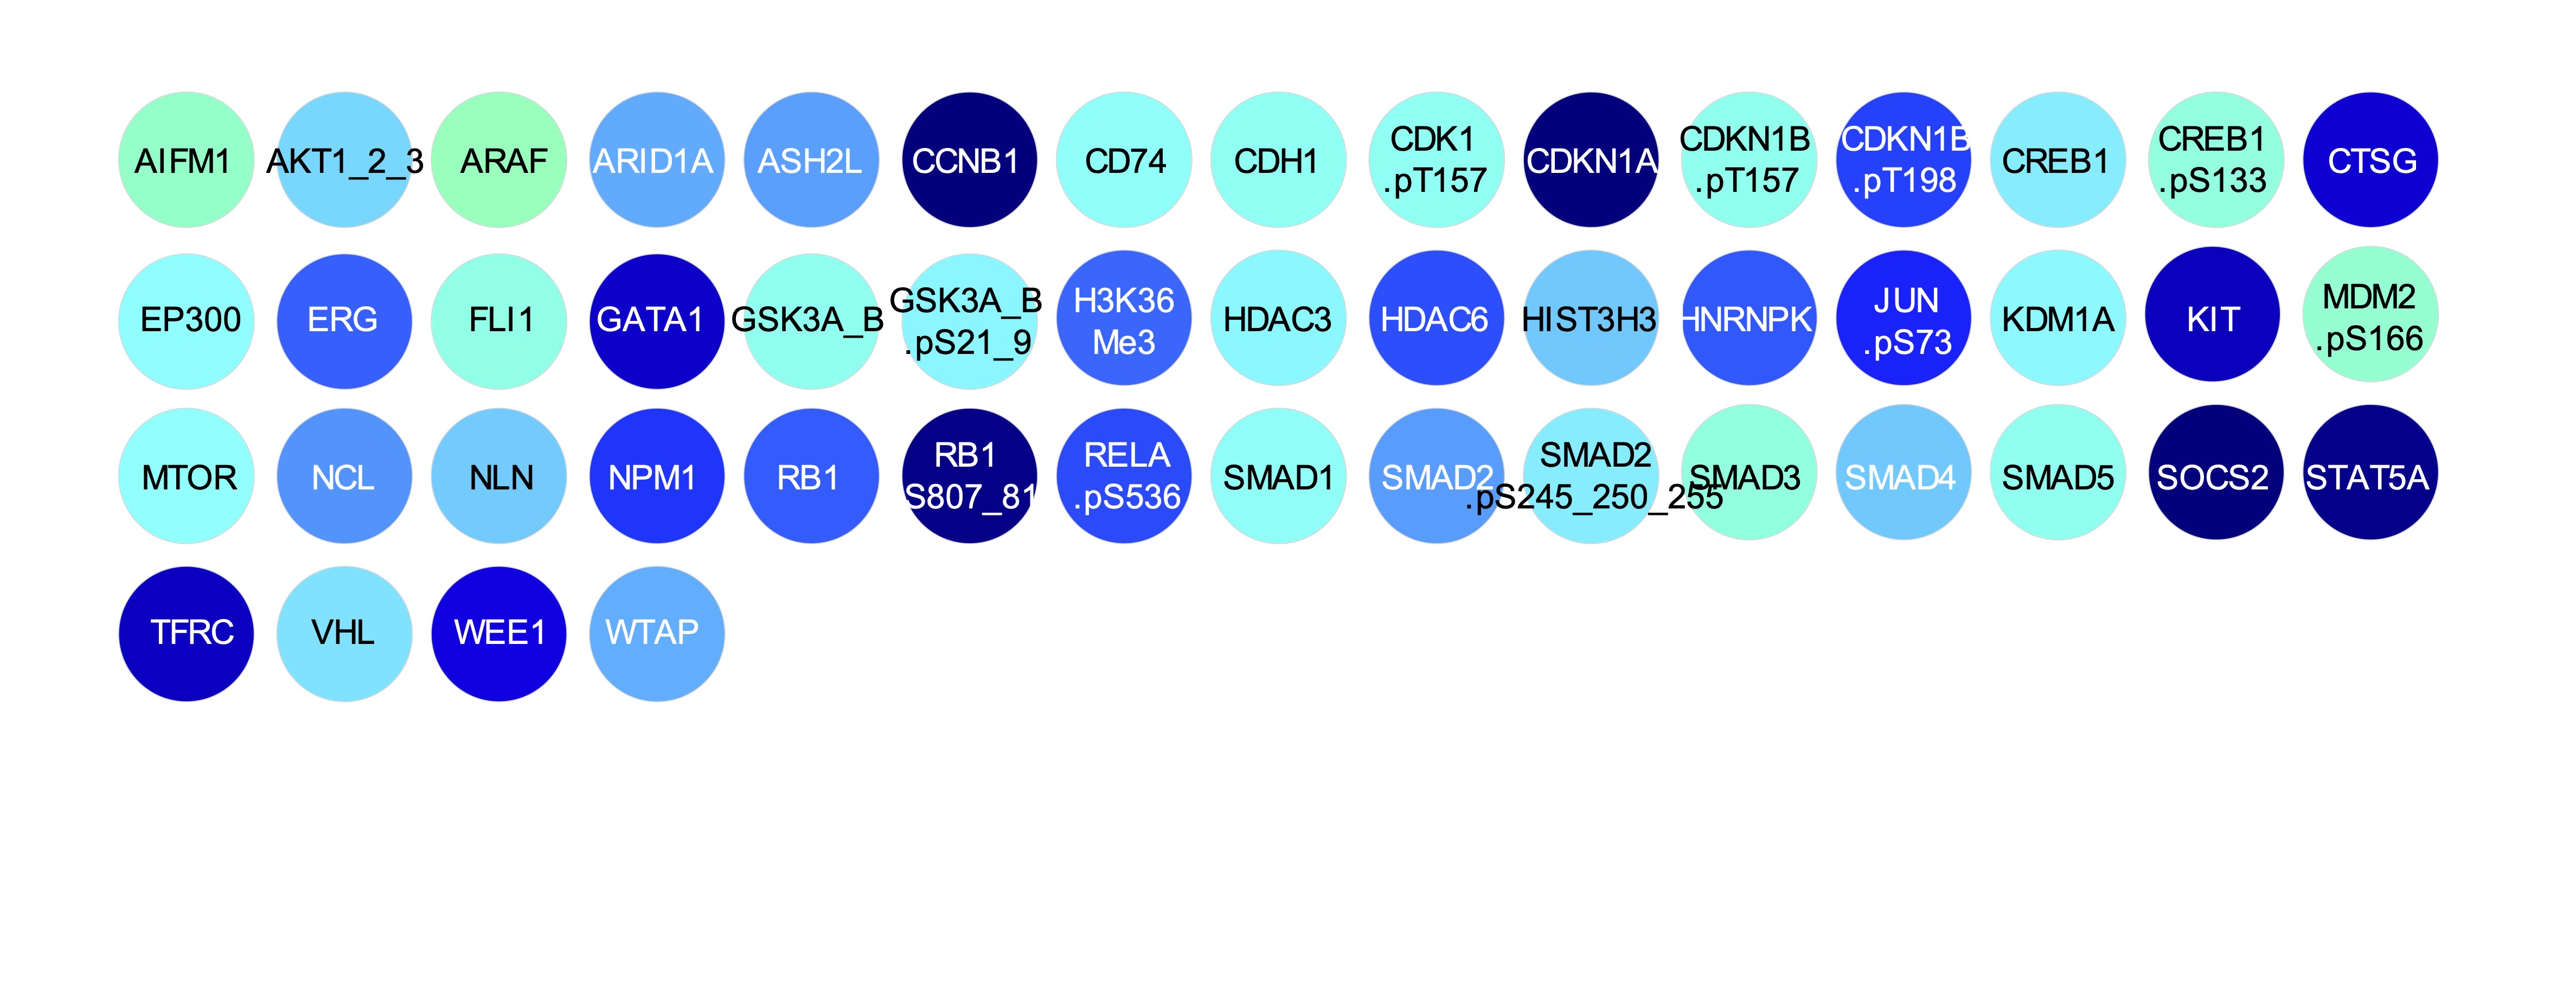
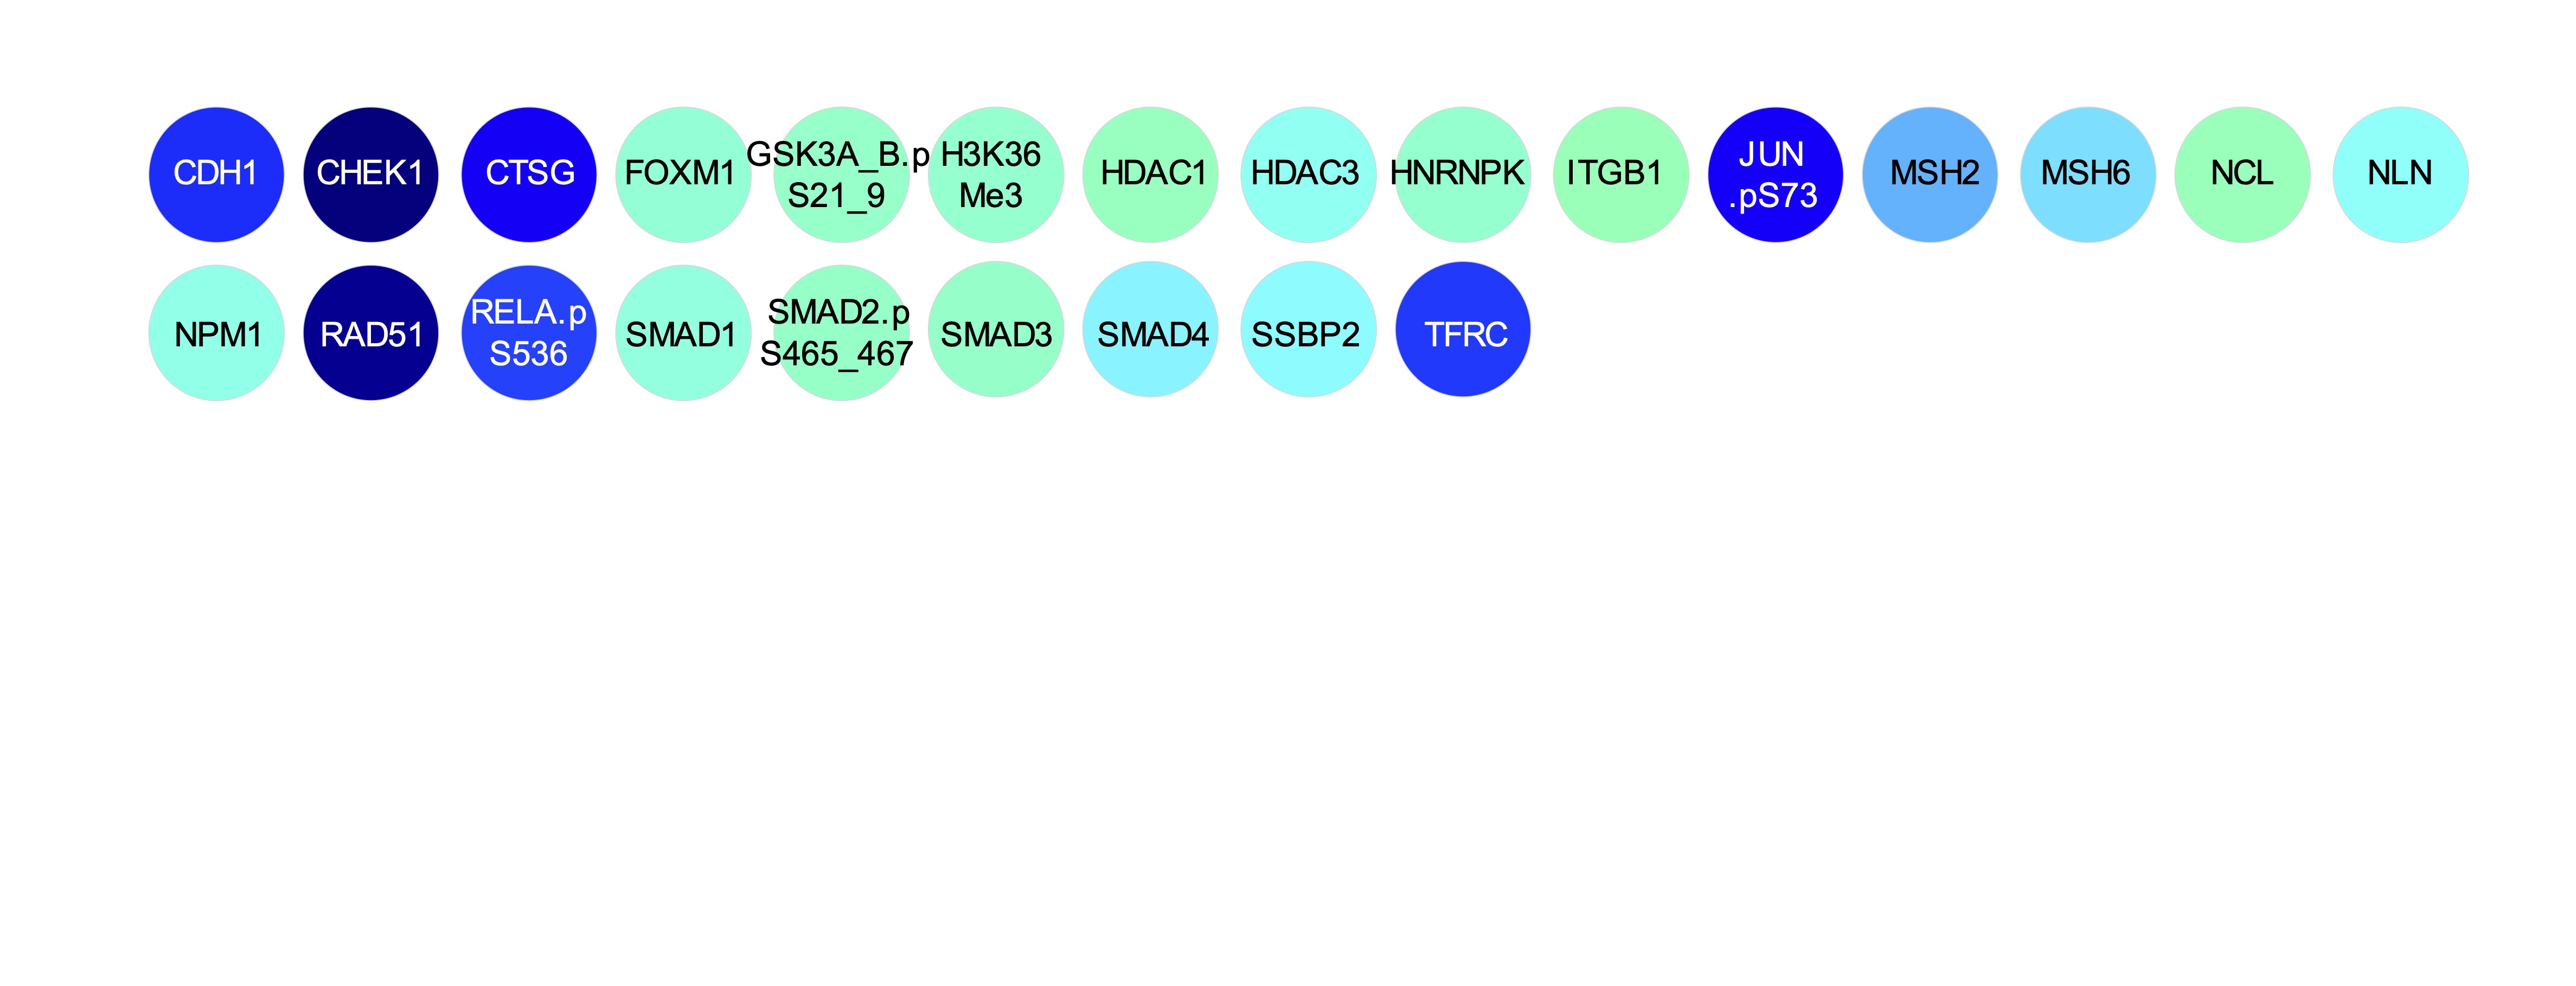
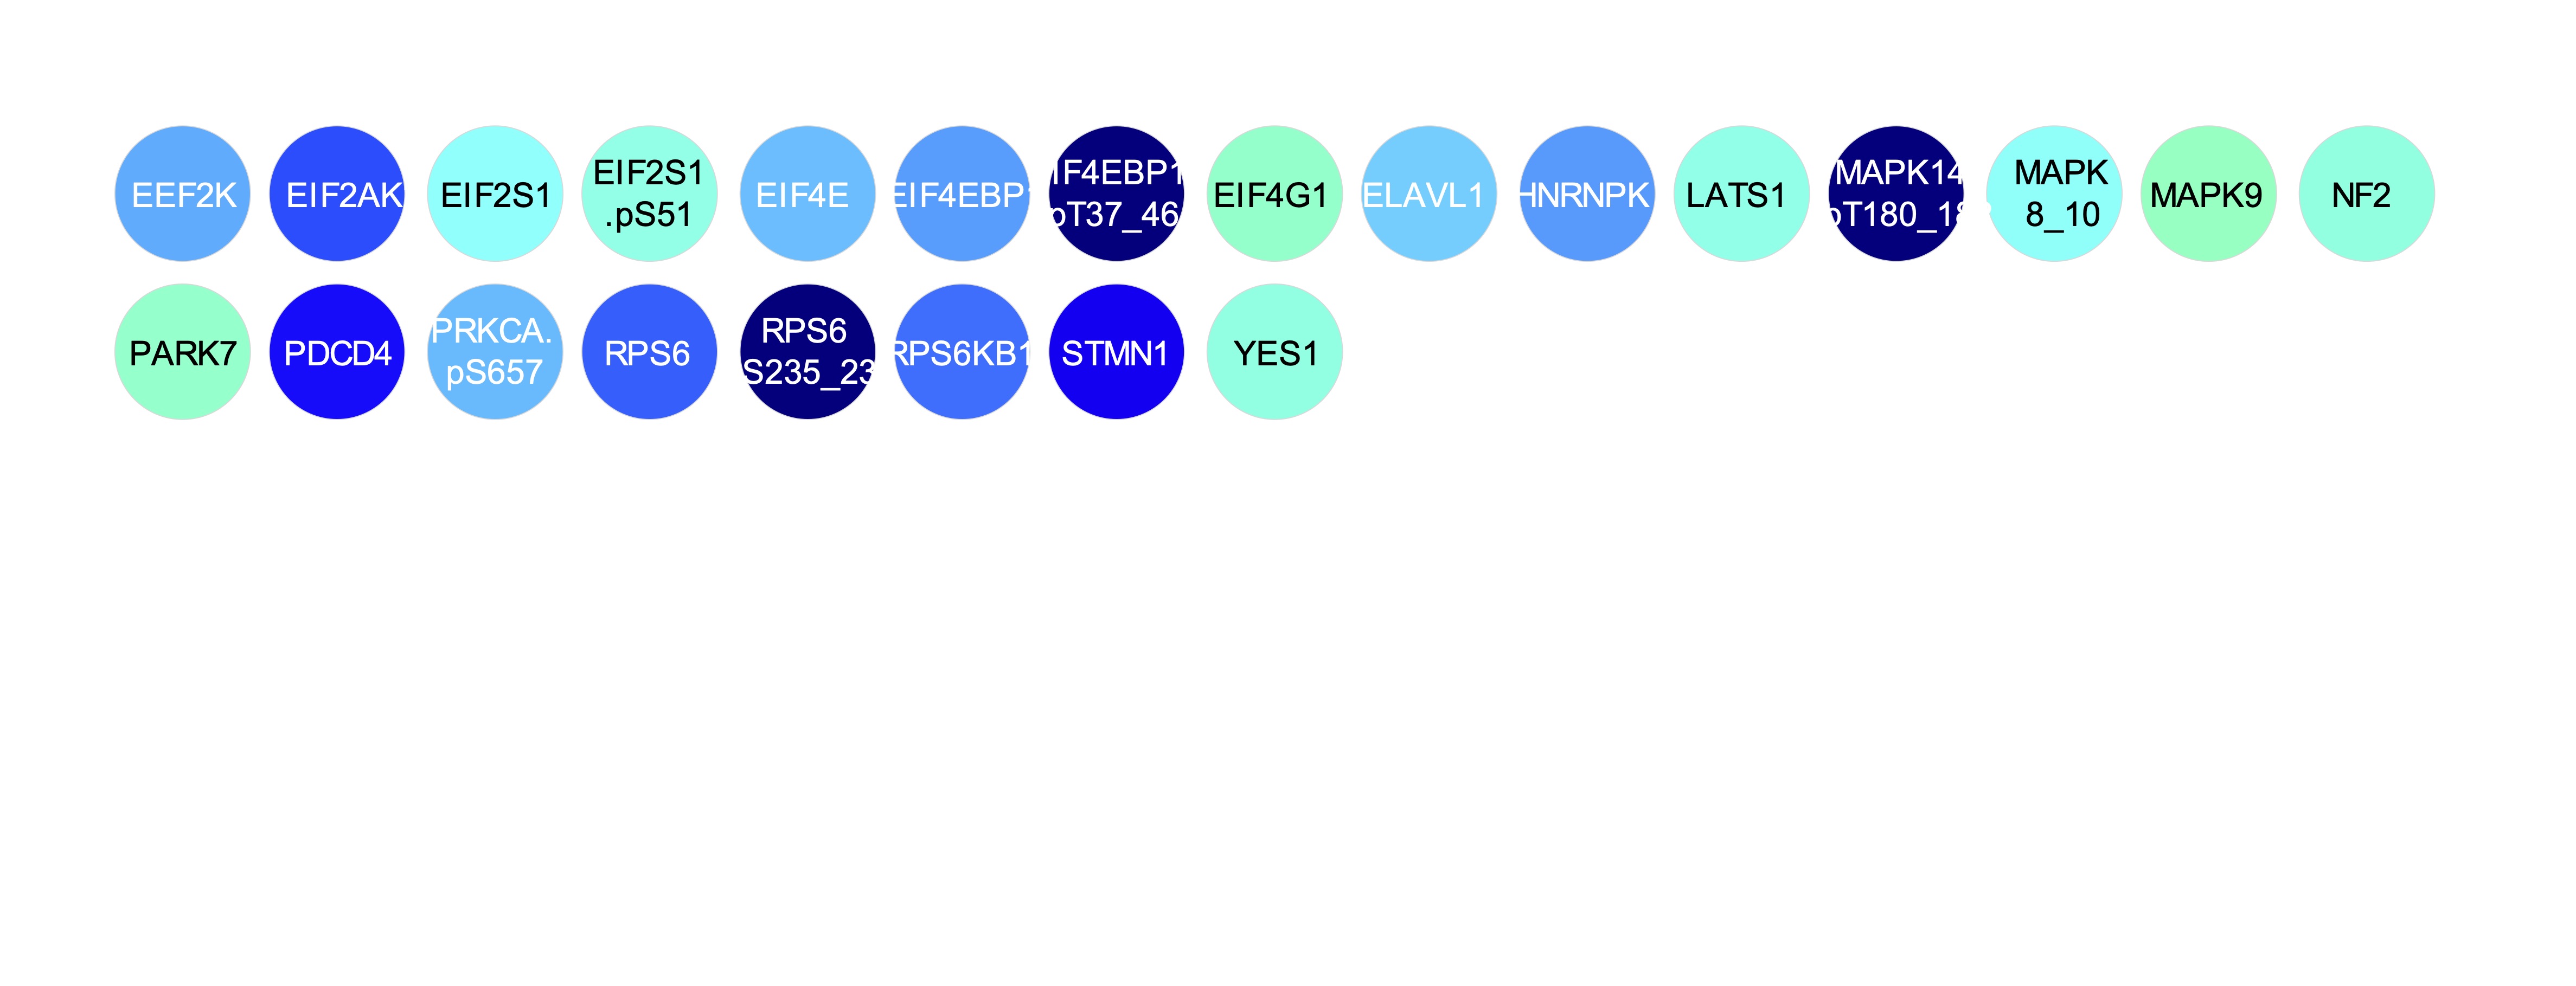
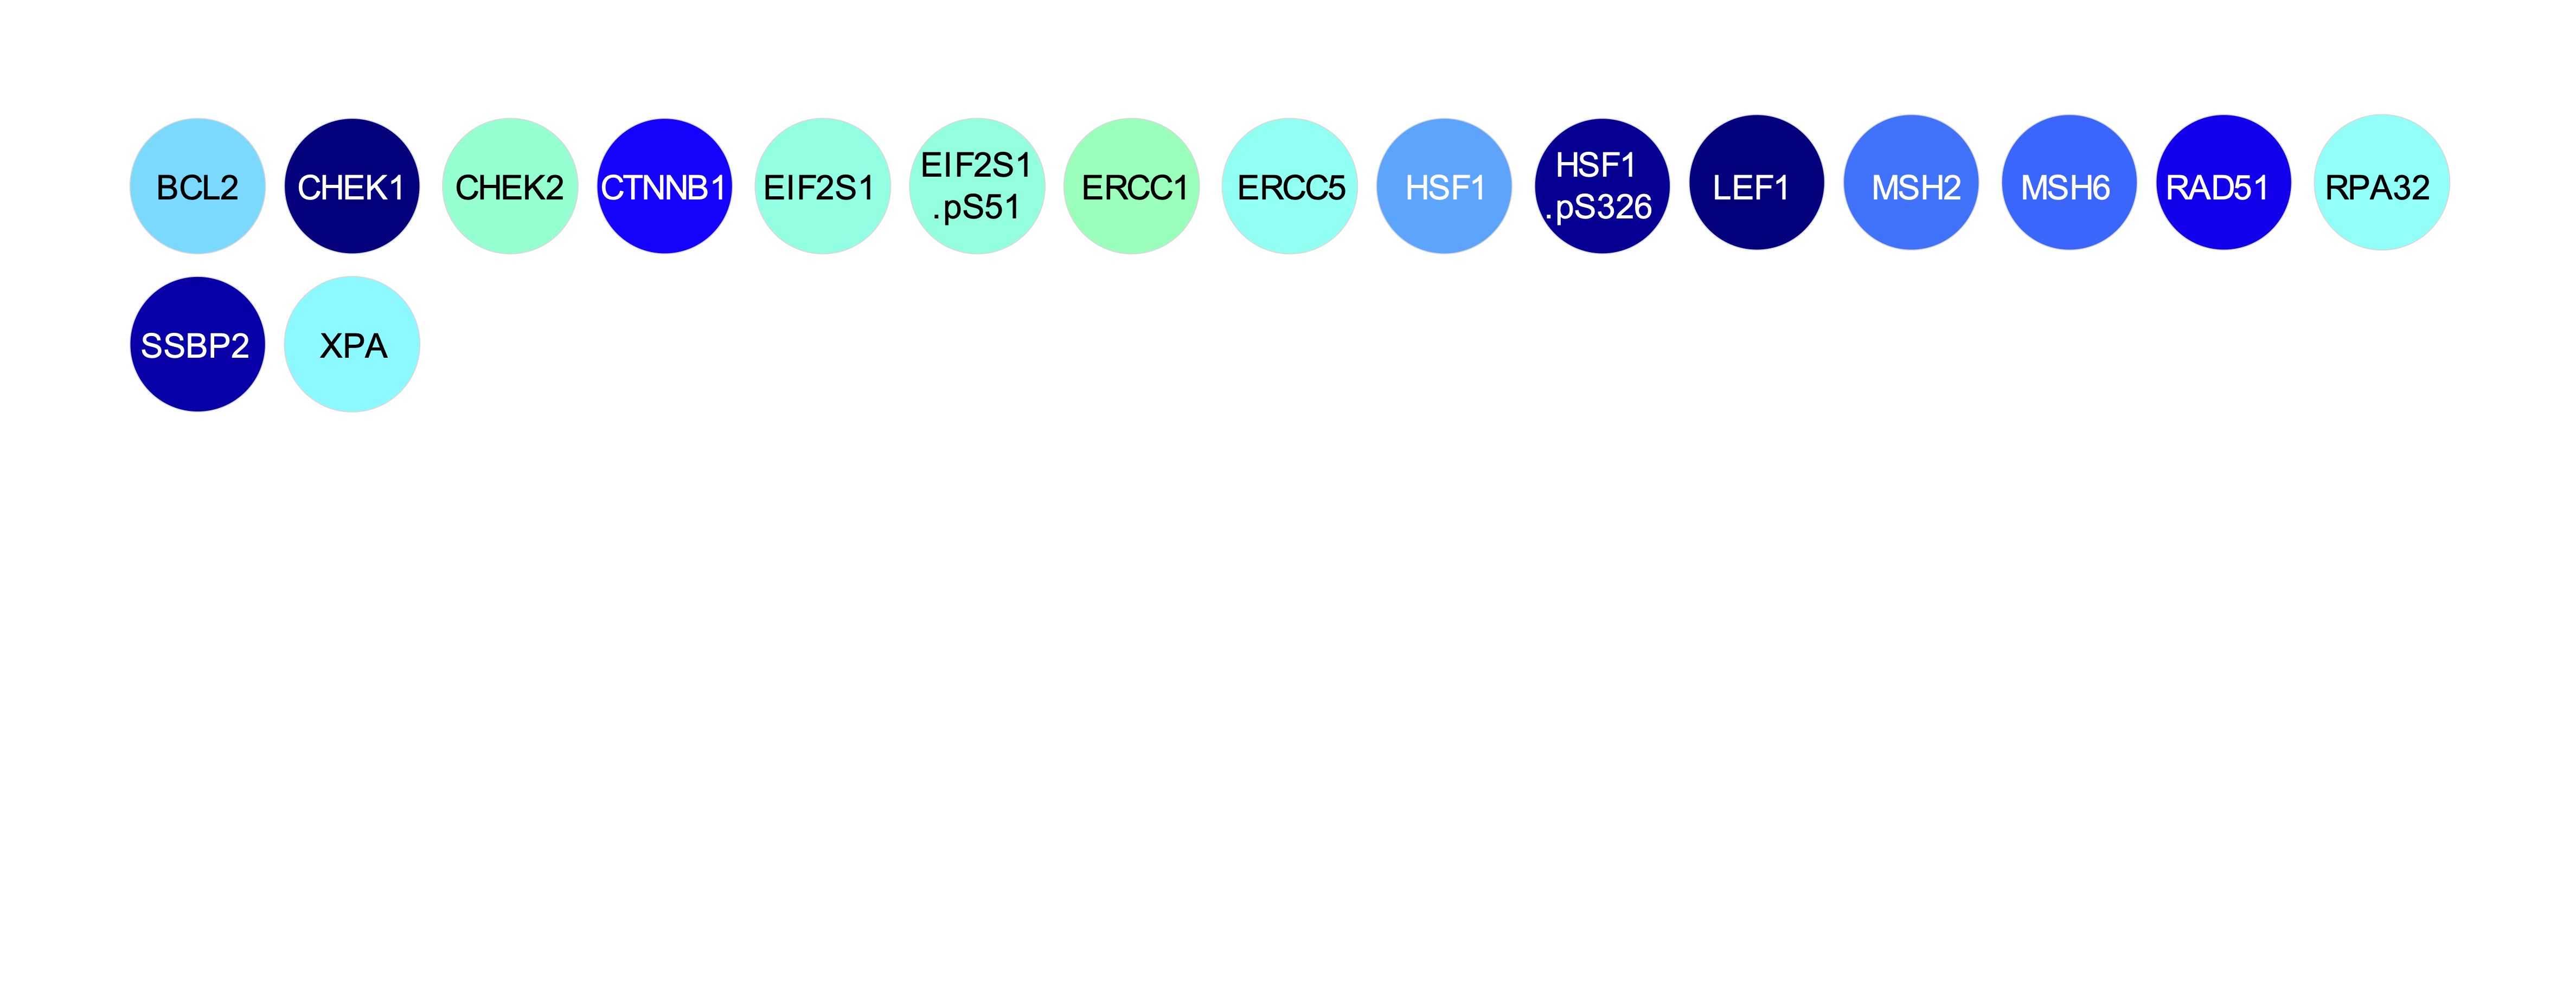
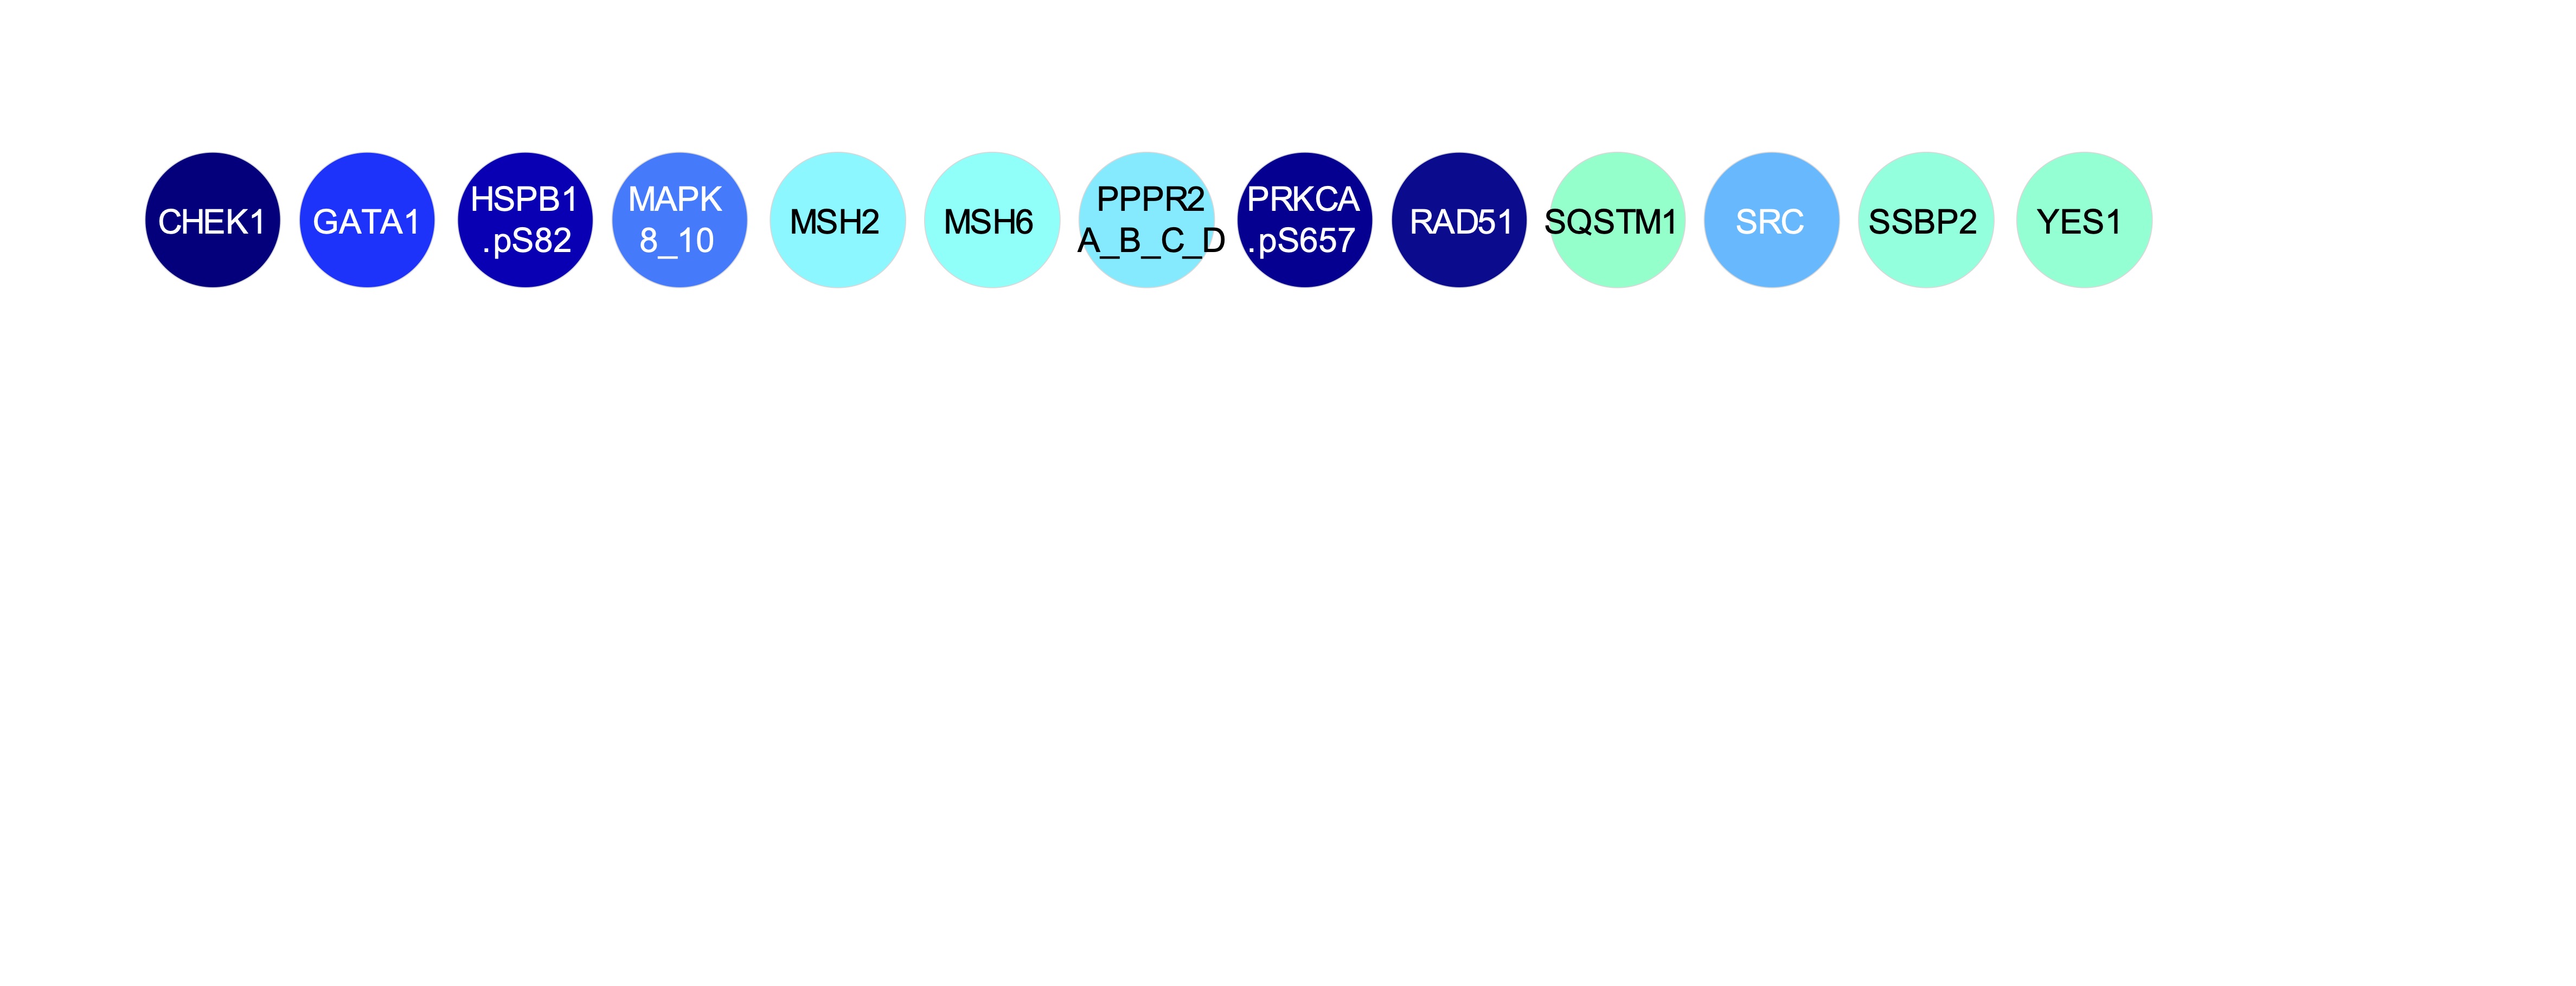
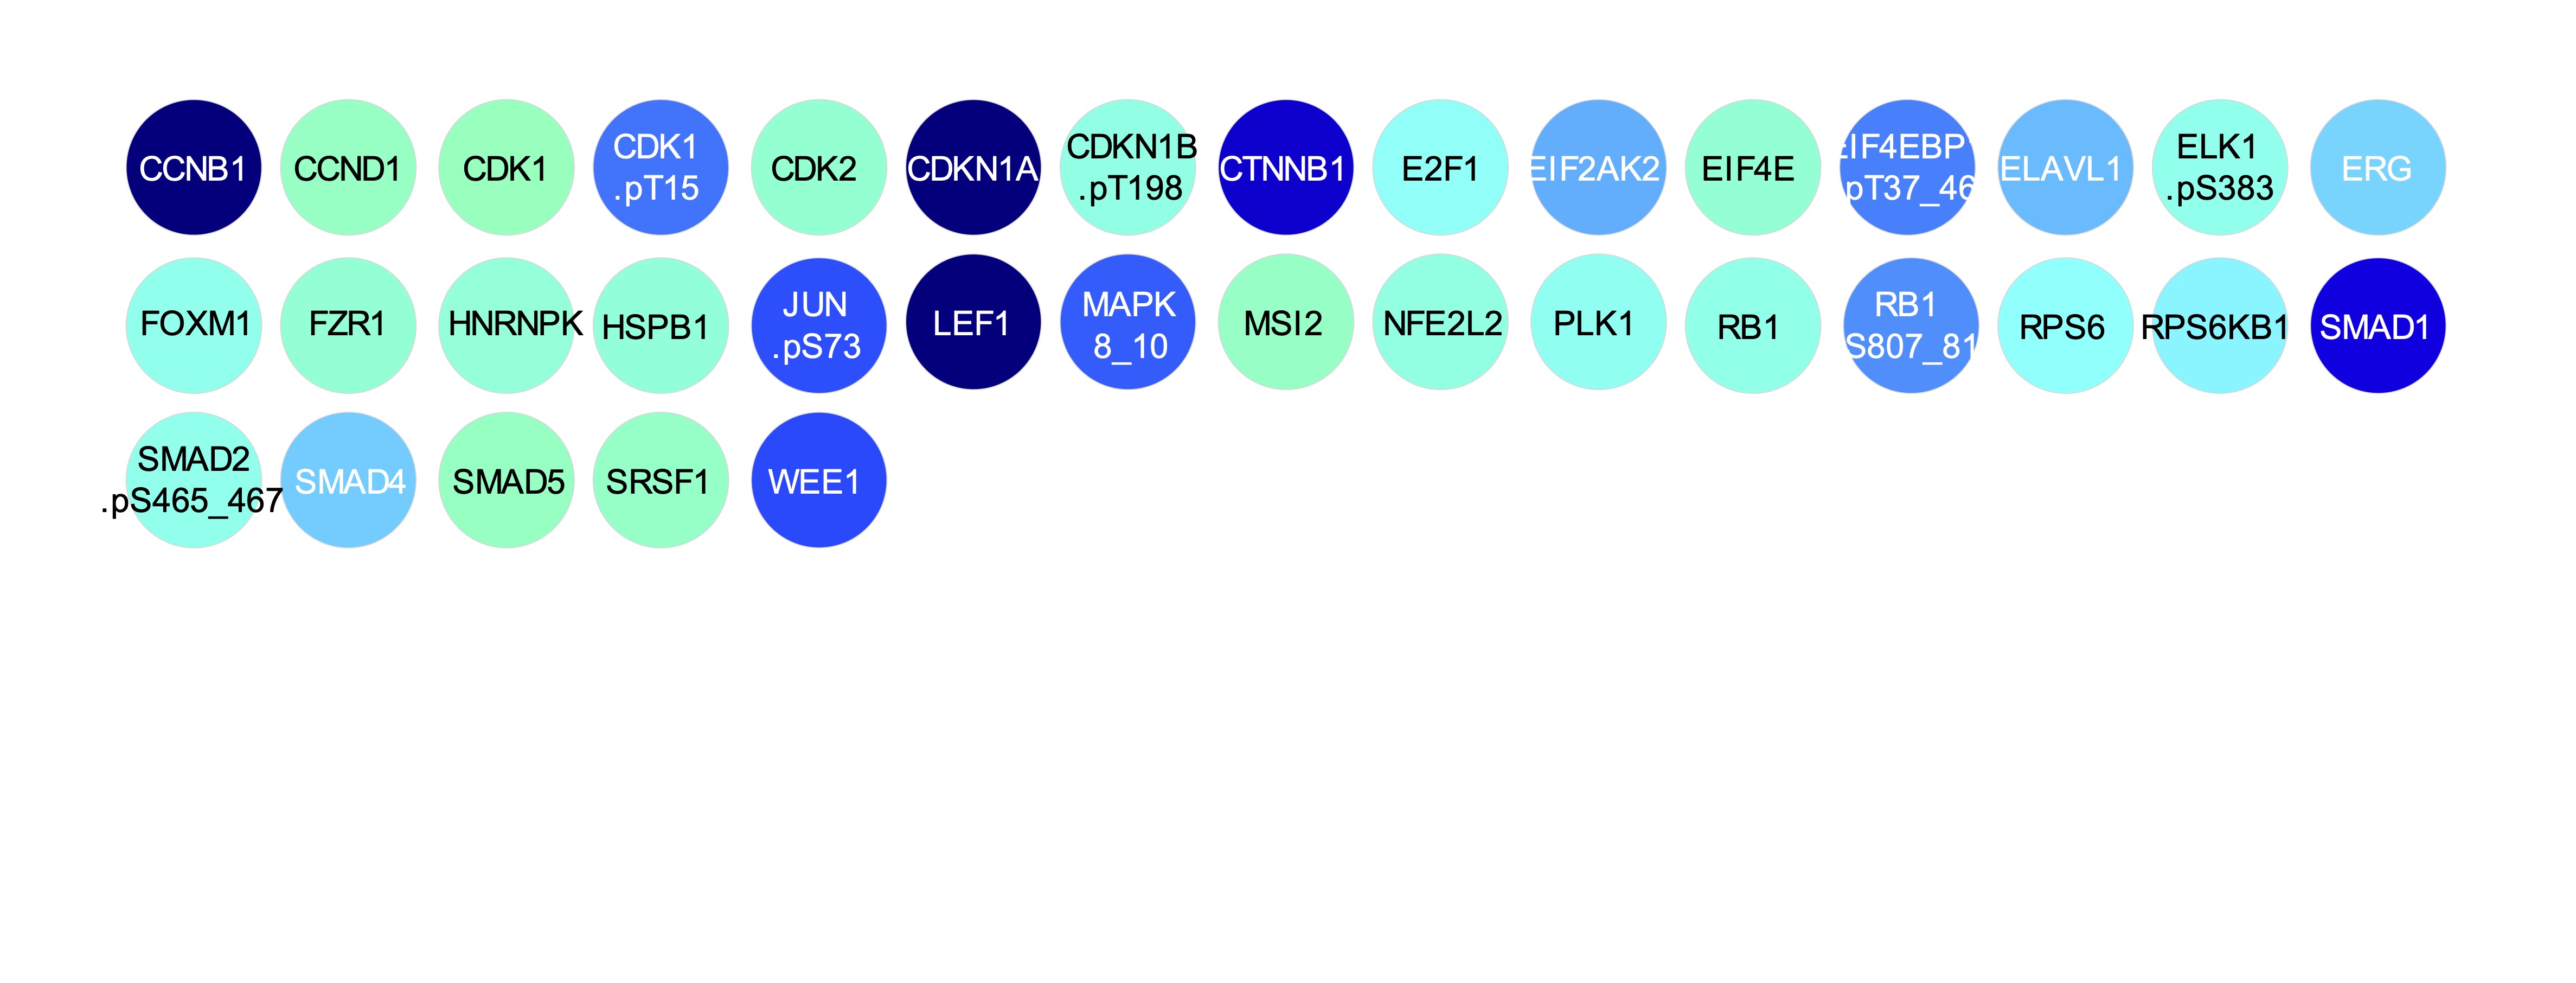
Pediatric acute myeloid leukemia patients clustered into protein expression signatures based on recurrent patterns of protein expression levels. "MetaGalaxy" shows data from 500 fresh peripheral blood samples.

Survival Curves

Overall Survival Event-Free Survival Relapse Risk
All ADE ADEB
os_tot efs_tot cr_tot os_all_DNMT3Amt os_all_DNMT3Awt efs_all_DNMT3Amt efs_all_DNMT3Awt cr_all_DNMT3Amt cr_all_DNMT3Awt os_all_IDH1mt efs_all_IDH1mt cr_all_IDH1mt os_all_IDH1wt efs_all_IDH1wt cr_all_IDH1wt os_all_IDH2mt efs_all_IDH2mt cr_all_IDH2mt os_all_IDH2wt efs_all_IDH2wt cr_all_IDH2wt os_all_N-MUT&F-MUT efs_all_N-MUT&F-MUT cr_all_N-MUT&F-MUT os_all_N-MUT&F-WT efs_all_N-MUT&F-WT cr_all_N-MUT&F-WT os_all_N-WT&F-MUT efs_all_N-WT&F-MUT cr_all_N-WT&F-MUT os_int efs_int cr_int os_int efs_int cr_int


Signature-based Drug Targets

Upregulated Downregulated

Signature or Constellation:

up1 up2 up3 up4 up5 up6 up7 up8 up9 up10 up11 up12 up13 up14 up15 up16 up17 up18 up19 up20 down1 down2 down3 down4 down5 down6 down7 down8 down9 down10 down11 down12 down13 down14 down15 down16 down17 down18 down19 down20