Heat shock

Heatmap

heatmap

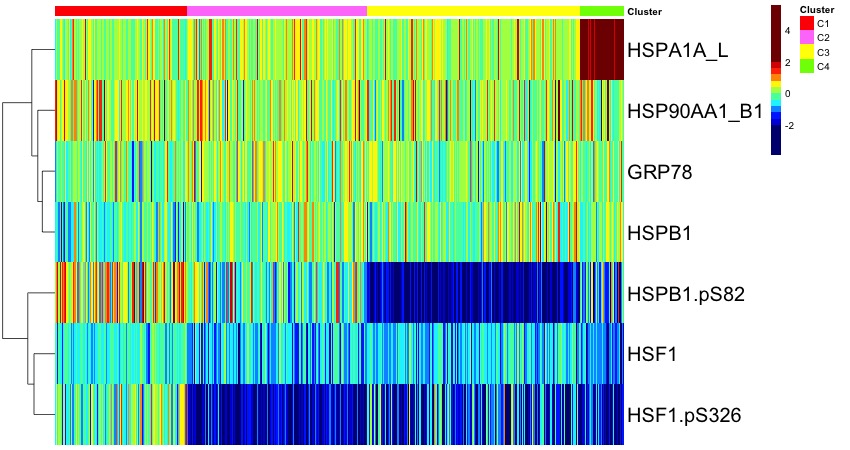
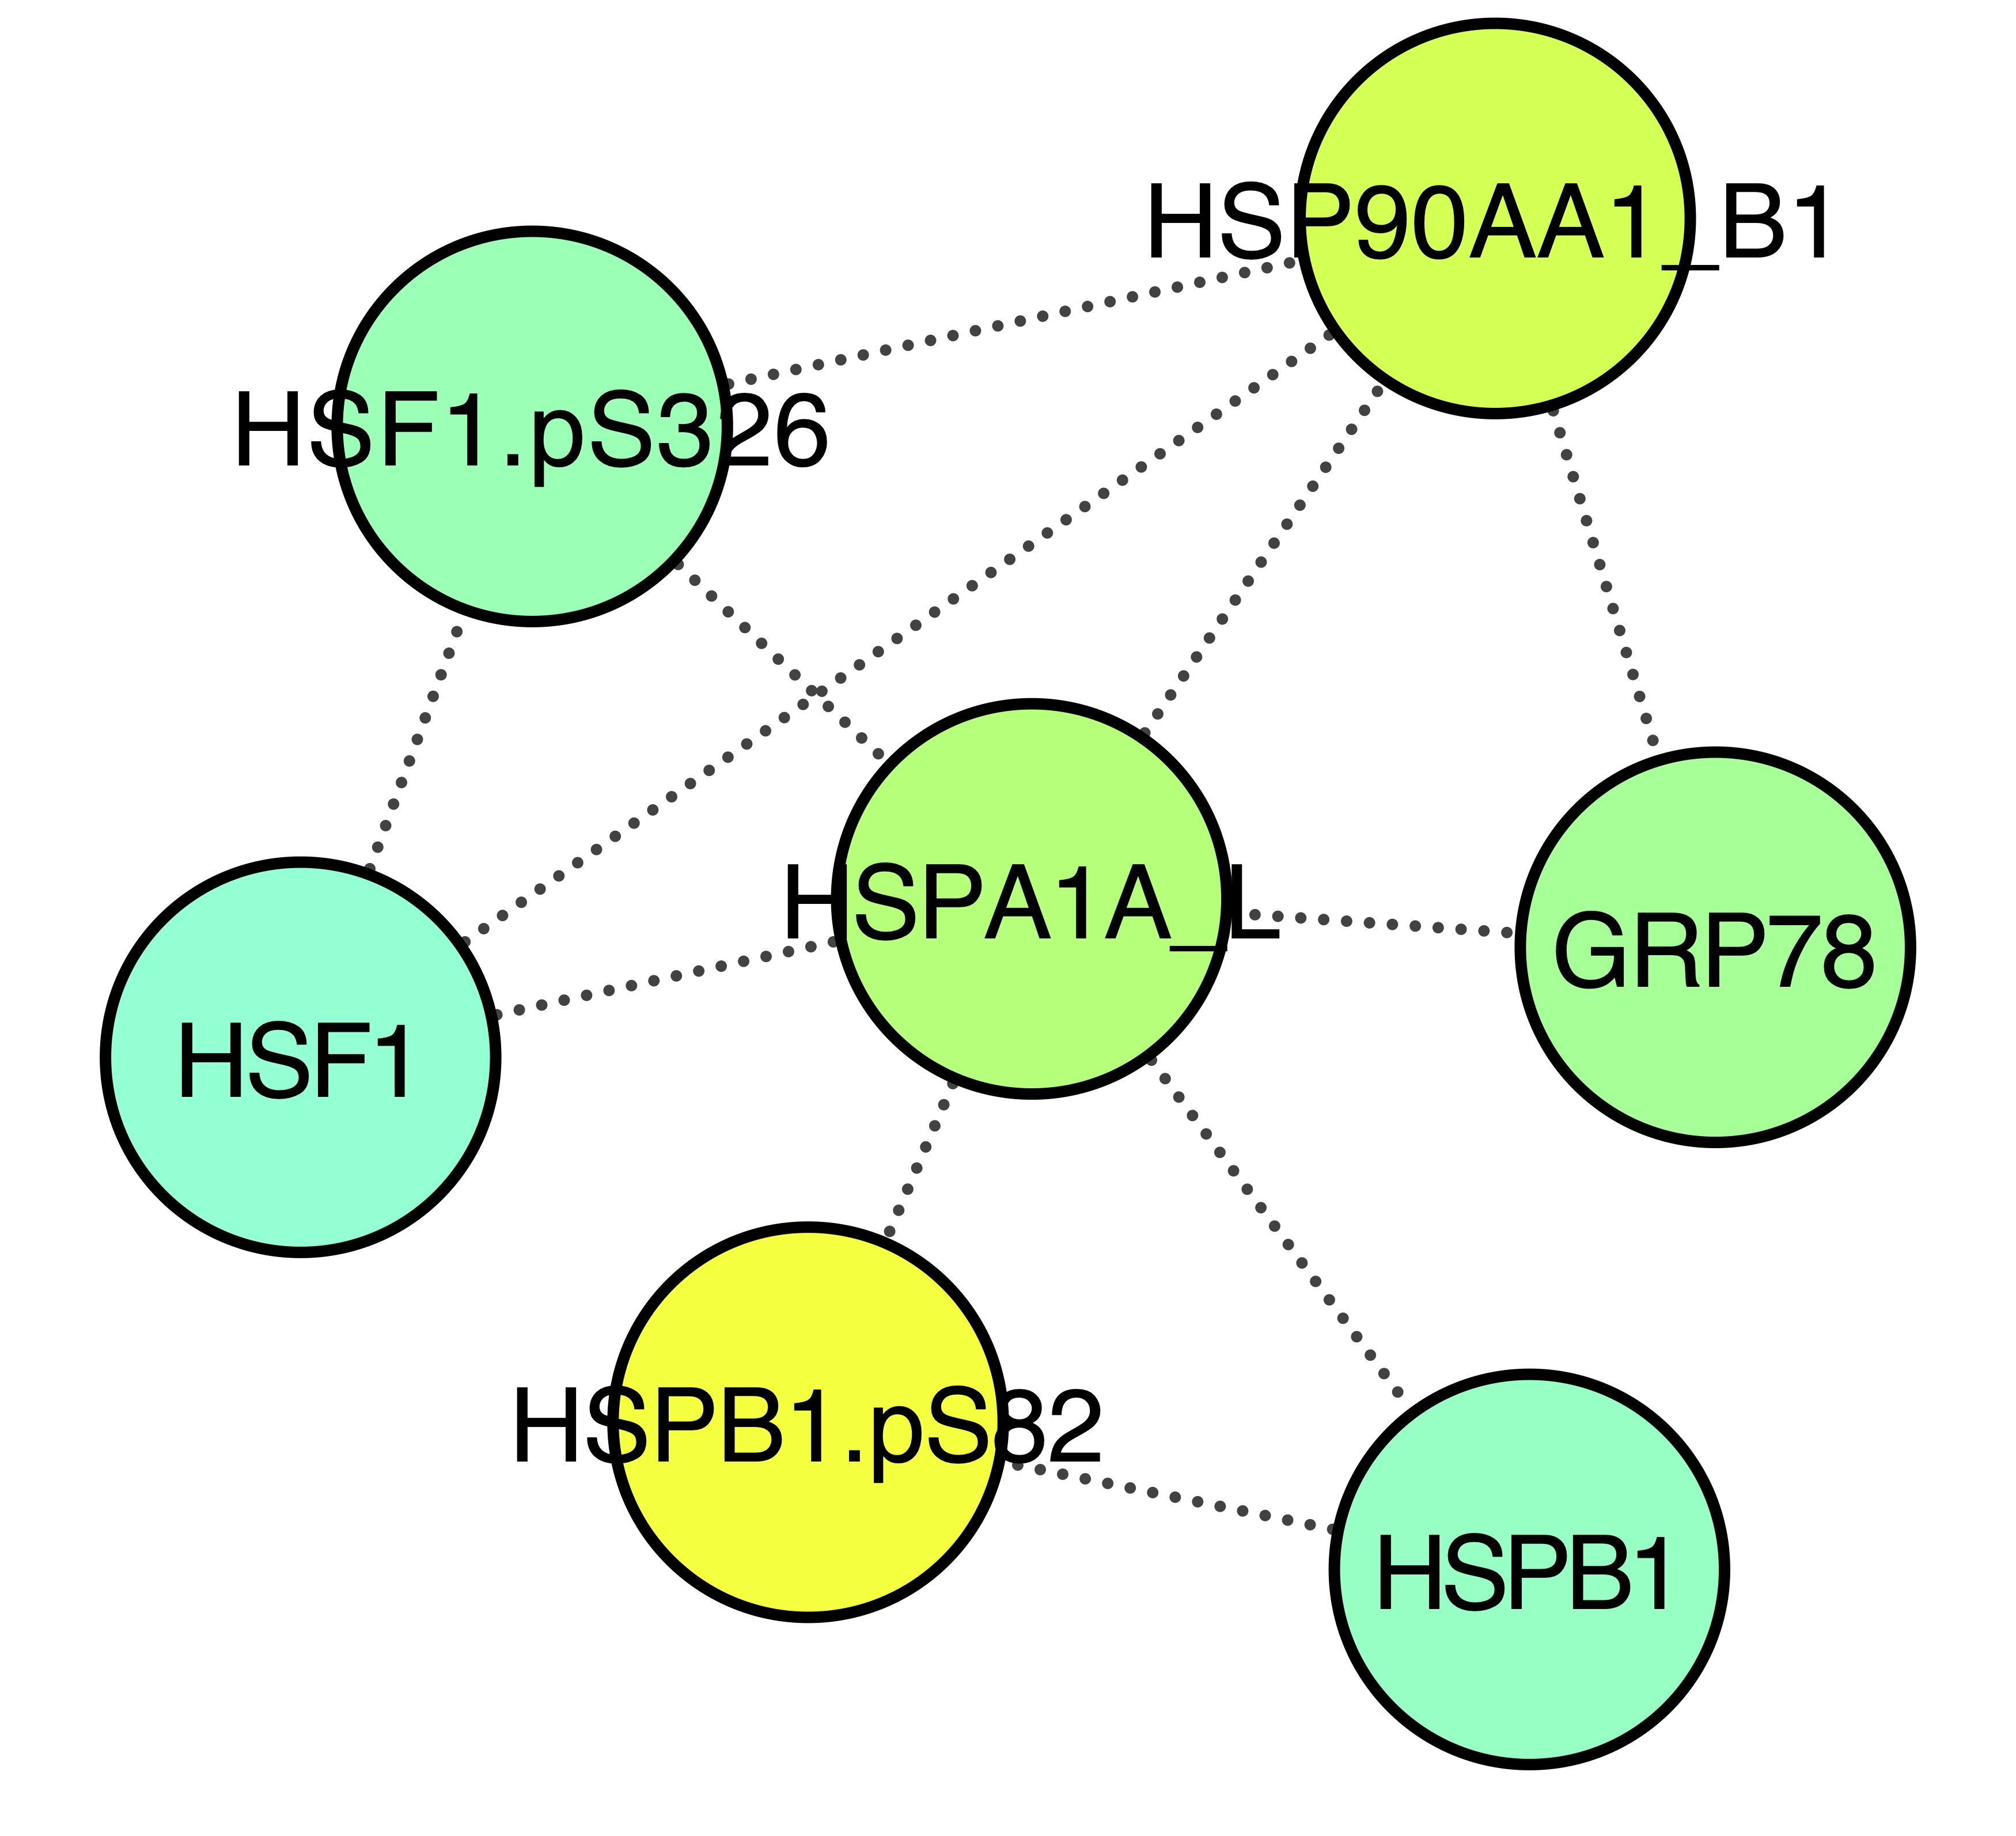
Pediatric acute myeloid leukemia patients clustered into groups by their heatshock proteins and phosphoprotein levels. Heatmap shows protein expression data from 500 peripheral blood patient samples relative to expression in 30 normal CD34+ samples.

Outcome Curves

Overall Survival Event-Free Survival Relapse Risk
All ADE ADEB
os_fav os_unf os_tot efs_tot cr_tot os_all_DNMT3Amt os_all_DNMT3Awt cr_all_DNMT3Amt cr_all_DNMT3Awt efs_all_DNMT3Amt efs_all_DNMT3Awt os_all_IDH1mt cr_all_IDH1mt efs_all_IDH1mt os_all_IDH1wt cr_all_IDH1wt efs_all_IDH1wt os_int efs_int cr_int efs_fav cr_fav cr_int

Functional Protein Expression Patterns

Protein cluster 1
Protein cluster 2
Protein cluster 3
Protein cluster 4